Berlin
by Leandro Lucarella on 2011- 06- 16 16:19 (updated on 2011- 06- 16 16:19)- with 0 comment(s)

CDGC merged into Tango
by Leandro Lucarella on 2011- 01- 28 22:49 (updated on 2011- 01- 28 22:49)- with 0 comment(s)
Yai! Finally my CDGC patches has been applied to Tango [1] [2] [3]. CDGC will not be the default Tango GC for now, because it needs some real testing first (and fixing a race when using weak references). So, please, please, do try it, is as simple as compiling from the sources adding a new option to bob: -g=cdgc and then manually installing Tango.
Please, don't forget to report any bugs or problems.
Thanks!
Engineer
by Leandro Lucarella on 2010- 12- 08 21:33 (updated on 2010- 12- 08 21:33)- with 0 comment(s)
Finally, I defended my thesis last Monday and now I'm officially (well, not really, the diploma takes about a year to be emitted) an Ingeniero en Informática (something like a Informatics Engineer). I hope I can get some free time now to polish the rough edges of the collector (fix the weakrefs for example) so it can be finally merged into Tango.
Día D
by Leandro Lucarella on 2010- 11- 30 22:31 (updated on 2010- 11- 30 22:31)- with 3 comment(s)
Finalmente, luego de más de una década de carrera (no voy a decir estudio porque de estudio fue bastante menos :), me recibo. Defiendo la tesis el lunes 6 a las 19:30 horas en el aula 402 de FIUBA y dejo el planito solo porque a alguna gente le resultó gracioso (por lo que me siento muy insultado).
Por si algún extra-terrestre está interesado en el tema, les dejo el abstract:
El manejo de memoria es un problema recurrente en los lenguajes de programación; dada su complejidad es muy propenso a errores y las consecuencias de dichos errores pueden ser muy graves. La recolección de basura es el área de investigación que trata las técnicas de manejo automático de memoria. D es un lenguaje de programación compilado, con tipado estático y multi-paradigma que combina el poder de lenguajes de programación de bajo nivel, como C, con la facilidad de los de alto nivel, como Python o Java. D provee recolección de basura pero ha sido frecuentemente criticada por sus varias falencias. Dadas las particularidades del lenguaje, plantea un desafío casi único en cuanto al diseño de un recolector.
Este trabajo hace un recorrido por el estado del arte en recolección de basura teniendo en cuenta los requerimientos de D; analiza la implementación del recolector actual y propone mejoras con el objetivo principal de minimizar los tiempos de pausa. Finalmente se construye un banco de pruebas para verificar los resultados, que muestran una disminución de hasta 200 veces en el tiempo de pausa del recolector y de hasta 3 veces en el tiempo total de ejecución.
CDGC experimental branch in Druntime
by Leandro Lucarella on 2010- 11- 09 18:51 (updated on 2010- 11- 09 18:51)- with 0 comment(s)
Sean Kelly just created a new experimental branch in Druntime with CDGC as the GC for D2. The new branch is completely untested though, so only people wanting to help testing should try it out (which will be very appreciated).
CDGC Tango integration
by Leandro Lucarella on 2010- 10- 21 02:34 (updated on 2010- 10- 21 02:34)- with 0 comment(s)
Trying CDGC HOWTO
by Leandro Lucarella on 2010- 10- 10 19:28 (updated on 2010- 10- 10 19:28)- with 0 comment(s)
Here are some details on how to try CDGC, as it needs a very particular setup, specially due to DMD not having precise heap scanning integrated yet.
Here are the steps (in some kind of literate scripting, you can copy&paste to a console ;)
# You probably want to do all this mess in some subdirectory :)
mkdir cdgc-test
cd cdgc-test

# First, checkout the repositories.
git clone git://git.llucax.com/software/dgc/cdgc.git
# If you have problems with git:// URLs, try HTTP:
# git clone https://git.llucax.com/r/software/dgc/cdgc.git
svn co http://svn.dsource.org/projects/tango/tags/releases/0.99.9 tango

# DMD doesn't care much (as usual) about tags, so you have to use -r to
# checkout the 1.063 revision (you might be good with the latest revision
# too).
svn co -r613 http://svn.dsource.org/projects/dmd/branches/dmd-1.x dmd

# Now we have to do some patching, let's start with Tango (only patch 3 is
# *really* necessary, but the others won't hurt).
cd tango
for p in 0001-Fixes-to-be-able-to-parse-the-code-with-Dil.patch \
         0002-Use-the-mutexattr-when-initializing-the-mutex.patch \
         0003-Add-precise-heap-scanning-support.patch \
         0004-Use-the-right-attributes-when-appending-to-an-empty-.patch
do
   wget -O- "https://llucax.com/blog/posts/2010/10/10-trying-cdgc-howto/$p" |
         patch -p1
done
cd ..

# Now let's go to DMD
cd dmd
p=0001-Create-pointer-map-bitmask-to-allow-precise-heap-sca.patch
wget -O- "https://llucax.com/blog/posts/2010/10/10-trying-cdgc-howto/$p" |
      patch -p1

# Since we are in the DMD repo, let's compile it (you may want to add -jN if
# you have N CPUs to speed up things a little).
make -C src -f linux.mak
cd ..

# Good, now we have to wire Tango and CDGC together, just create a symbolic
# link:
cd tango
ln -s ../../../../../cdgc/rt/gc/cdgc tango/core/rt/gc/

# Since I don't know very well the Tango build system, I did a Makefile of my
# own to compile it, so just grab it and compile Tango with it. It will use
# the DMD you just compiled and will compile CDGC by default (you can change
# it via the GC Make variable, for example: make GC=basic to compile Tango
# with the basic GC). The library will be written to obj/libtango-$GC.a, so
# you can have both CDGB and the basic collector easily at hand):
wget https://llucax.com/blog/posts/2010/10/10-trying-cdgc-howto/Makefile
make # Again add -jN if you have N CPUs to make a little faster

# Now all you need now is a decent dmd.conf to put it all together:
cd ..
echo "[Environment]" > dmd/src/dmd.conf
echo -n "DFLAGS=-I$PWD/tango -L-L$PWD/tango/obj " >> dmd/src/dmd.conf
echo -n "-defaultlib=tango-cdgc " >> dmd/src/dmd.conf
echo "-debuglib=tango-cdgc -version=Tango" >> dmd/src/dmd.conf

# Finally, try a Hello World:
cat <<EOT > hello.d
import  tango.io.Console;

void main()
{
   Cout("Hello, World").newline;
}
EOT
dmd/src/dmd -run hello.d

# If you don't trust me and you want to be completely sure you have CDGC
# running, try the collect_stats_file option to generate a log of the
# collections:
D_GC_OPTS=collect_stats_file=log dmd/src/dmd -run hello.d
cat log
Done!
If you want to make this DMD the default, just add dmd/src to the PATH environment variable or do a proper installation ;)
Let me know if you hit any problem...
CDGC done
by Leandro Lucarella on 2010- 09- 28 15:16 (updated on 2010- 09- 28 15:16)- with 0 comment(s)
I'm sorry about the quick and uninformative post, but I've been almost 2 weeks without Internet and I have to finish the first complete draft of my thesis in a little more than a week, so I don't have much time to write here.
The thing is, to avoid the nasty effect of memory usage being too high for certain programs when using eager allocation, I've made the GC minimize the heap more often. Even when some test are still a little slower with CDGC, but that's only for tests that only stress the GC without doing any actual work, so I think it's OK, in that cases the extra overhead of being concurrent is bigger than the gain (which is inexistent, because there is nothing to do in parallel with the collector).
Finally, I've implemented early collection, which didn't proved very useful, and tried to keep a better occupancy factor of the heap with the new min_free option, without much success either (it looks like the real winner was eager allocation).
I'm sorry I don't have time to show you some graphs this time. Of course the work is not really finished, there are plenty of things to be done still, but I think the GC have come to a point where it can be really useful, and I have to finish my thesis :)
After I'm done, I hope I can work on integrating the GC in Tango and/or Druntime (where there is already a first approach done by Sean Kelly).
Truly concurrent GC using eager allocation
by Leandro Lucarella on 2010- 09- 10 03:01 (updated on 2010- 09- 10 03:01)- with 0 comment(s)
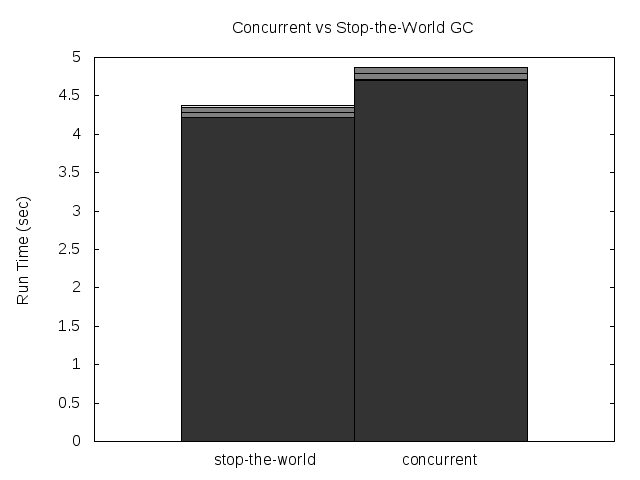
Finally, I got the first version of CDGC with truly concurrent garbage collection, in the sense that all the threads of the mutator (the program itself) can run in parallel with the collector (well, only the mark phase to be honest :).
You might want to read a previous post about CDGC where I achieved some sort of concurrency by making only the stop-the-world time very short, but the thread that triggered the collection (and any other thread needing any GC service) had to wait until the collection finishes. The thread that triggered the collection needed to wait for the collection to finish to fulfill the memory allocation request (it was triggered because the memory was exhausted), while any other thread needing any GC service needed to acquire the global GC lock (damn global GC lock!).
To avoid this issue, I took a simple approach that I call eager allocation, consisting on spawn the mark phase concurrently but allocating a new memory pool to be able to fulfill the memory request instantly. Doing so, not only the thread that triggered the collection can keep going without waiting the collection to finish, the global GC lock is released and any other thread can use any GC service, and even allocate more memory, since a new pool was allocated.
If the memory is exhausted again before the collection finishes, a new pool is allocated, so everything can keep running. The obvious (bad) consequence of this is potential memory bloat. Since the memory usage is minimized from time to time, this effect should not be too harmful though, but let's see the results, there are plenty of things to analyze from them (a lot not even related to concurrency).
First, a couple of comments about the plots:
- Times of Dil are multiplied by a factor of 0.1 in all the plots, times of rnddata are too, but only in the pause time and stop-the-world plots. This is only to make the plots more readable.
- The unreadable labels rotated 45 degrees say: stw, fork and ea. Those stand for Stop-the-world (the basic collector), fork only (concurrent but without eager allocation) and eager allocation respectively. You can click on the images to see a little more readable SVG version.
- The plots are for one CPU-only because using more CPUs doesn't change much (for these plots).
- The times were taken from a single run, unlike the total run time plots I usually post. Since a single run have multiple collections, the information about min, max, average and standard deviation still applies for the single run.
- Stop-the-world time is the time no mutator thread can run. This is not related to the global GC lock, is time the threads are really really paused (this is even necessary for the forking GC to take a snapshot of threads CPU registers and stacks). So, the time no mutator thread can do any useful work might be much bigger than this time, because the GC lock. This time is what I call Pause time. The maximum pause time is probably the most important variable for a GC that tries to minimize pauses, like this one. Is the maximum time a program will stay totally unresponsive (important for a server, a GUI application, a game or any interactive application).

The stop-the-world time is reduced so much that you can hardly see the times of the fork and ea configuration. It's reduced in all tests by a big margin, except for mcore and the bigarr. For the former it was even increased a little, for the later it was reduced but very little (but only for the ea* configuration, so it might be a bad measure). This is really measuring the Linux fork() time. When the program manages so little data that the mark phase itself is so fast that's faster than a fork(), this is what happens. The good news is, the pause times are small enough for those cases, so no harm is done (except from adding a little more total run time to the program).
Note the Dil maximum stop-the-world time, it's 0.2 seconds, looks pretty big, uh? Well, now remember that this time was multiplied by 0.1, the real maximum stop-the-world for Dil is 2 seconds, and remember this is the minimum amount of time the program is unresponsive! Thank god it's not an interactive application :)
Time to take a look to the real pause time:

OK, this is a little more confusing... The only strong pattern is that pause time is not changed (much) between the swt and fork configurations. This seems to make sense, as both configurations must wait for the whole collection to finish (I really don't know what's happening with the bh test).
For most tests (7), the pause time is much smaller for the ea configuration, 3 tests have much bigger times for it, one is bigger but similar (again mcore) and then is the weird case of bh. The 7 tests where the time is reduced are the ones that seems to make sense, that's what I was looking for, so let's see what's happening with the remaining 3, and for that, let's take a look at the amount of memory the program is using, to see if the memory bloat of allocating extra pools is significant.
| Test | Maximum heap size (MB) | ||
|---|---|---|---|
| Program | stw | ea | ea/stw |
| dil | 216 | 250 | 1.16 |
| rnddata | 181 | 181 | 1 |
| voronoi | 16 | 30 | 1.88 |
| tree | 7 | 114 | 16.3 |
| bh | 80 | 80 | 1 |
| mcore | 30 | 38 | 1.27 |
| bisort | 30 | 30 | 1 |
| bigarr | 11 | 223 | 20.3 |
| em3d | 63 | 63 | 1 |
| sbtree | 11 | 122 | 11.1 |
| tsp | 63 | 63 | 1 |
| split | 39 | 39 | 1 |
See any relations between the plot and the table? I do. It looks like some programs are not being able to minimize the memory usage, and because of that, the sweep phase (which still have to run in a mutator thread, taking the global GC lock) is taking ages. An easy to try approach is to trigger the minimization of the memory usage not only at when big objects are allocated (like it is now), but that could lead to more mmap()/munmap()s than necessary. And there still problems with pools that are kept alive because a very small object is still alive, which is not solved by this.
So I think a more long term solution would be to introduce what I call early collection too. Meaning, trigger a collection before the memory is exhausted. That would be the next step in the CDGC.
Finally, let's take a look at the total run time of the test programs using the basic GC and CDGC with concurrent marking and eager allocation. This time, let's see what happens with 2 CPUs (and 25 runs):

Wow! It looks like this is getting really juicy (with exceptions, as usual :)! Dil time is reduced to about 1/3, voronoi is reduced to 1/10!!! Split and mcore have both their time considerably reduced, but that's because another small optimization (unrelated to what we are seeing today), so forget about those two. Same for rnddata, which is reduced because of precise heap scanning. But other tests increased its runtime, most notably bigarr takes almost double the time. Looking at the maximum heap size table, one can find some answers for this too. Another ugly side of early allocation.
For completeness, let's see what happens with the number of collections triggered during the program's life. Here is the previous table with this new data added:
| Test | Maximum heap size (MB) | Number of collections | ||||
|---|---|---|---|---|---|---|
| Program | stw | ea | ea/stw | stw | ea | ea/stw |
| dil | 216 | 250 | 1.16 | 62 | 50 | 0.81 |
| rnddata | 181 | 181 | 1 | 28 | 28 | 1 |
| voronoi | 16 | 30 | 1.88 | 79 | 14 | 0.18 |
| tree | 7 | 114 | 16.3 | 204 | 32 | 0.16 |
| bh | 80 | 80 | 1 | 27 | 27 | 1 |
| mcore | 30 | 38 | 1.27 | 18 | 14 | 0.78 |
| bisort | 30 | 30 | 1 | 10 | 10 | 1 |
| bigarr | 11 | 223 | 20.3 | 305 | 40 | 0.13 |
| em3d | 63 | 63 | 1 | 14 | 14 | 1 |
| sbtree | 11 | 122 | 11.1 | 110 | 33 | 0.3 |
| tsp | 63 | 63 | 1 | 14 | 14 | 1 |
| split | 39 | 39 | 1 | 7 | 7 | 1 |
See how the number of collections is practically reduced proportionally to the increase of the heap size. When the increase in size explodes, even when the number of collections is greatly reduced, the sweep time take over and the total run time is increased. Specially in those tests where the program is almost only using the GC (as in sbtree and bigarr). That's why I like the most Dil and voronoi as key tests, they do quite a lot of real work beside asking for memory or using other GC services.
This confirms that the performance gain is not strictly related to the added concurrency, but because of a nice (finally! :) side-effect of eager allocation: removing some pressure from the GC by increasing the heap size a little (Dil gets 3x boost in run time for as little as 1.16x of memory usage; voronoi gets 10x at the expense of almost doubling the heap, I think both are good trade-offs). This shows another weak point of the GC, sometimes the HEAP is way too tight, triggering a lot of collections, which leads to a lot of GC run time overhead. Nothing is done right now to keep a good heap occupancy ratio.
But is there any real speed (in total run time terms) improvement because of the added concurrency? Let's see the run time for 1 CPU:

It looks like there is, specially for my two favourite tests: both Dil and voronoi get a 30% speed boost! That's not bad, not bad at all...
If you want to try it, the repository has been updated with this last changes :). If you do, please let me know how it went.
Recursive vs. iterative marking
by Leandro Lucarella on 2010- 08- 30 00:54 (updated on 2010- 08- 30 00:54)- with 0 comment(s)
After a small (but important) step towards making the D GC truly concurrent (which is my main goal), I've been exploring the possibility of making the mark phase recursive instead of iterative (as it currently is).
The motivation is that the iterative algorithm makes several passes through the entire heap (it doesn't need to do the full job on each pass, it processes only the newly reachable nodes found in the previous iteration, but to look for that new reachable node it does have to iterate over the entire heap). The number of passes is the same as the connectivity graph depth, the best case is where all the heap is reachable through the root set, and the worse is when the heap is a single linked list. The recursive algorithm, on the other hand, needs only a single pass but, of course, it has the problem of potentially consuming a lot of stack space (again, the recurse depth is the same as the connectivity graph depth), so it's not paradise either.
To see how much of a problem is the recurse depth in reality, first I've implemented a fully recursive algorithm, and I found it is a real problem, since I had segmentation faults because the (8MiB by default in Linux) stack overflows. So I've implemented an hybrid approach, setting a (configurable) maximum recurse depth for the marking phase. If the maximum depth is reached, the recursion is stopped and nodes that should be scanned deeply than that are queued to scanned in the next iteration.
Here are some results showing how the total run time is affected by the maximum recursion depth:
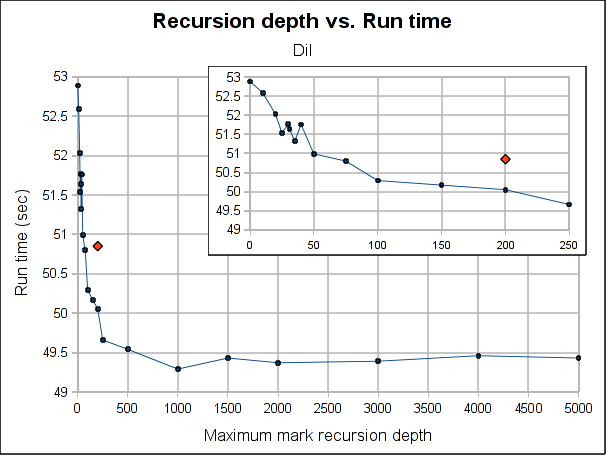
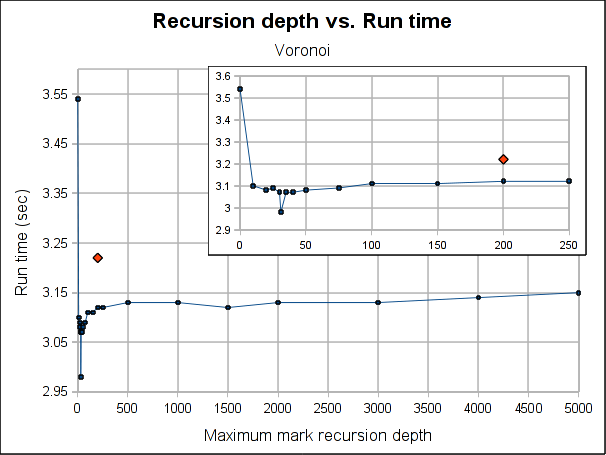
The red dot is how the pure iterative algorithm currently performs (it's placed arbitrarily in the plot, as the X-axis doesn't make sense for it).
The results are not very conclusive. Even when the hybrid approach performs better for both Dil and Voronoi when the maximum depth is bigger than 75, the better depth is program specific. Both have its worse case when depth is 0, which makes sense, because is paying the extra complexity of the hybrid algorithm with using its power. As soon as we leave the 0 depth, a big drop is seen, for Voronoi big enough to outperform the purely iterative algorithm, but not for Dil, which matches it near 60 and clearly outperforms it at 100.
As usual, Voronoi challenges all logic, as the best depth is 31 (it was a consistent result among several runs). Between 20 and 50 there is not much variation (except for the magic number 31) but when going beyond that, it worsen slowly but constantly as the depth is increased.
Note that the plots might make the performance improvement look a little bigger than it really is. The best case scenario the gain is 7.5% for Voronoi and 3% for Dil (which is probably better measure for the real world). If I had to choose a default, I'll probably go with 100 because is where both get a performance gain and is still a small enough number to ensure no segmentation faults due to stack exhaustion is caused (only) by the recursiveness of the mark phase (I guess a value of 1000 would be reasonable too, but I'm a little scared of causing inexplicable, magical, mystery segfaults to users). Anyway, for a value of 100, the performance gain is about 1% and 3.5% for Dil and Voronoi respectively.
So I'm not really sure if I should merge this change or not. In the best case scenarios (which requires a work from the user to search for the better depth for its program), the performance gain is not exactly huge and for a reasonable default value is so little that I'm not convinced the extra complexity of the change (because it makes the marking algorithm a little more complex) worth it.
Feel free to leave your opinion (I would even appreciate it if you do :).
CDGC first breath
by Leandro Lucarella on 2010- 08- 23 02:03 (updated on 2010- 08- 23 02:03)- with 0 comment(s)
I'm glad to announce that now, for the first time, CDGC means Concurrent D Garbage Collector, as I have my first (extremely raw and unoptimized) version of the concurrent GC running. And I have to say, I'm very excited and happy with the results from the very small benchmark I did.
The stop-the-world (pause) time was reduced by 2 orders of magnitude for the average, the standard deviation and, probably the more important, the maximum (these are the results for a single run, measuring the pause time for all the collections in that run). This is good news for people needing (soft) real-time in D, even when using the GC. Where the standard D GC have a pause time of 100ms, the CDGC have a pause time of 1ms.
The total run-time of the program was increased a little though, but not as much as the pause time was reduced. Only a 12% performance loss was measured, but this is just the first raw unoptimized version of the CDGC.
All this was measured with the voronoi benchmark, with -n 30000. Here are some plots:
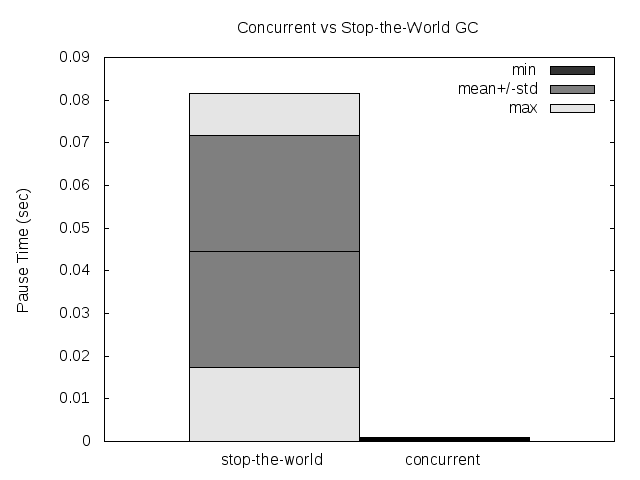
Please note that the GC still has a global lock, so if 2 threads needs to allocate while the collection is running, both will be paused anyways (I have a couple of ideas on how to try to avoid that).
The idea about how to make the GC concurrent is based on the paper Nonintrusive Cloning Garbage Collector with Stock Operating System Support. I'm particularly excited by the results because the reduction of the pause time in the original paper were less than 1 order of magnitude better than their stop-the-world collector, so the preliminary results of the CDGC are much better than I expected.
TypeInfo, static data and the GC
by Leandro Lucarella on 2010- 08- 16 00:39 (updated on 2010- 08- 16 00:39)- with 0 comment(s)
The D compiler doesn't provide any information on the static data that the GC must scan, so the runtime/GC have to use OS-dependant tricks to get that information.
Right now, in Linux, the GC gets the static data to scan from the libc's variables __data_start and _end, from which are not much information floating around except for some e-mail from Hans Boehm to the binutils mainling list.
There is a lot of stuff in the static data that doesn't need to be scanned, most notably the TypeInfo, which is a great portion of the static data. C libraries static data, for example, would be scanned too, when it makes no sense to do so.
I noticed CDGC has more than double the static data the basic GC has, just because of TypeInfo (I use about 5 or so more types, one of them is a template, which makes the bloat bigger).
The voronoi test goes from 21KB to 26KB of static data when using CDGC.
It would be nice if the compiler could group all the static that must really be scanned (programs static variables) together and make its limits available to the GC. It would be even nicer to leave static variables that have no pointers out of that group, and even much more nicer to create a pointer map like the one in the patch for precise scanning to allow precise heap scanning. Then only the scan should be scanned in full conservative mode.
I reported a bug with this issue so it doesn't get lost.
Memory allocation patterns
by Leandro Lucarella on 2010- 08- 14 06:28 (updated on 2010- 08- 14 16:09)- with 0 comment(s)
Note
Tango 0.99.9 has a bug in its runtime, which sometimes makes the GC scan memory that should not be scanned. It only affects Dil and Voronoi programs, but in a significant way. The tests in this post are done using a patched runtime, with the bug fixed.
Update
The results for the unpublished programs are now available. You can find the graphic results, the detailed summary and the source code for all the programs (except dil, which can be downloaded from its home site).
After seeing some weird behaviours and how different benchmarks are more or less affected by changes like memory addresses returned by the OS or by different ways to store the type information pointer, I decided to gather some information about how much and what kind of memory are requested by the different benchmarks.
I used the information provided by the malloc_stats_file CDGC option, and generated some stats.
The analysis is done on the allocations requested by the program (calls to gc_malloc()) and contrasting that with the real memory allocated by the GC. Note that only the GC heap memory (that is, memory dedicated to the program, which the GC scans in the collections) is counted (internal GC memory used for bookkeeping is not).
Also note that in this post I generally refer to object meaning a block of memory, it doesn't mean they are actually instance of a class or anything. Finally bear in mind that all the figures shown here are the sum of all the allocations done in the life of a program. If the collected data says a program requested 1GiB of memory, that doesn't mean the program had a residency of 1GiB, the program could had a working set of a few KiB and recycled memory like hell.
When analyzing the real memory allocated by the GC, there are two modes being analyzed, one is the classic conservative mode and the other is the precise mode (as it is in the original patch, storing the type information pointer at the end of the blocks). So the idea here is to measure two major things:
- The amount of memory wasted by the GC because of how it arranges memory as fixed-size blocks (bins) and large objects that uses whole pages.
- The extra amount of memory wasted by the GC when using precise mode because it stores the type information pointer at the end of the blocks.
I've selected a few representative benchmarks. Here are the results:
bh allocation pattern
This is a translation by Leonardo Maffi from the Olden Benchmark that does a Barnes–Hut simulation. The program is CPU intensive an does a lot of allocation of about 5 different small objects.
Here is a graphic summary of the allocation requests and real allocated memory for a run with -b 4000:


We can easily see here how the space wasted by the GC memory organization is significant (about 15% wasted), and how the type information pointer is adding an even more significant overhead (about 36% of the memory is wasted). This means that this program will be 15% more subject to false pointers (and will have to scan some extra memory too, but fortunately the majority of the memory doesn't need to be scanned) than it should in conservative mode and that the precise mode makes things 25% worse.
You can also see how the extra overhead in the precise mode is because some objects that should fit in a 16 bin now need a 32 bytes bin to hold the extra pointer. See how there were no waste at all in the conservative mode for objects that should fit a 16 bytes bin. 117MiB are wasted because of that.
Here is a more detailed (but textual) summary of the memory requested and allocated:
- Requested
- Total
- 15,432,462 objecs, 317,236,335 bytes [302.54MiB]
- Scanned
- 7,757,429 (50.27%) objecs, 125,360,510 bytes [119.55MiB] (39.52%)
- Not scanned
- 7,675,033 (49.73%) objecs, 191,875,825 bytes [182.99MiB] (60.48%)
- Different object sizes
- 8
- Objects requested with a bin size of:
- 16 bytes
- 7,675,064 (49.73%) objects, 122,801,024 bytes [117.11MiB] (38.71%)
- 32 bytes
- 7,734,214 (50.12%, 99.85% cumulative) objects, 193,609,617 bytes [184.64MiB] (61.03%, 99.74% cumulative)
- 64 bytes
- 23,181 (0.15%, 100% cumulative) objects, 824,988 bytes [805.65KiB] (0.26%, 100% cumulative)
- 256 bytes
- 2 (0%, 100% cumulative) objects, 370 bytes (0%, 100% cumulative)
- 512 bytes
- 1 (0%, 100% cumulative) objects, 336 bytes (0%, 100% cumulative)
- Allocated
- Conservative mode
- Total allocated
- 371,780,480 bytes [354.56MiB]
- Total wasted
- 54,544,145 bytes [52.02MiB], 14.67%
- Wasted due to objects that should use a bin of
- 16 bytes
- 0 bytes (0%)
- 32 bytes
- 53,885,231 bytes [51.39MiB] (98.79%, 98.79% cumulative)
- 64 bytes
- 658,596 bytes [643.16KiB] (1.21%, 100% cumulative)
- 256 bytes
- 142 bytes (0%, 100% cumulative)
- 512 bytes
- 176 bytes (0%, 100% cumulative)
- Precise mode
- Total allocated
- 495,195,296 bytes [472.26MiB]
- Total wasted
- 177,958,961 bytes [169.71MiB], 35.94%
- Wasted due to objects that should use a bin of
- 16 bytes
- 122,801,024 bytes [117.11MiB] (69.01%)
- 32 bytes
- 54,499,023 bytes [51.97MiB] (30.62%, 99.63% cumulative)
- 64 bytes
- 658,596 bytes [643.16KiB] (0.37%, 100% cumulative)
- 256 bytes
- 142 bytes (0%, 100% cumulative)
- 512 bytes
- 176 bytes (0%, 100% cumulative)
bigarr allocation pattern
This is a extremely simple program that just allocate a big array of small-medium objects (all of the same size) I found in the D NG.
Here is the graphic summary:


The only interesting part of this test is how many space is wasted because of the memory organization, which in this case goes up to 30% for the conservative mode (and have no change for the precise mode).
Here is the detailed summary:
- Requested
- Total
- 12,000,305 objecs, 1,104,160,974 bytes [1.03GiB]
- Scanned
- 12,000,305 (100%) objecs, 1,104,160,974 bytes [1.03GiB] (100%)
- Not scanned
- 0 (0%) objecs, 0 bytes (0%)
- Different object sizes
- 5
- Objects requested with a bin size of
- 128 bytes
- 12,000,000 (100%, 100% cumulative) objects, 1,056,000,000 bytes [1007.08MiB] (95.64%, 95.64% cumulative)
- 256 bytes
- 2 (0%, 100% cumulative) objects, 322 bytes (0%, 95.64% cumulative)
- 512 bytes
- 1 (0%, 100% cumulative) objects, 336 bytes (0%, 95.64% cumulative)
- more than a page
- 302 (0%) objects, 48,160,316 bytes [45.93MiB] (4.36%)
- Allocated
- Conservative mode
- Total allocated
- 1,584,242,808 bytes [1.48GiB]
- Total wasted
- 480,081,834 bytes [457.84MiB], 30.3%
- Wasted due to objects that should use a bin of
- 128 bytes
- 480,000,000 bytes [457.76MiB] (99.98%, 99.98% cumulative)
- 256 bytes
- 190 bytes (0%, 99.98% cumulative)
- 512 bytes
- 176 bytes (0%, 99.98% cumulative)
- more than a page
- 81,468 bytes [79.56KiB] (0.02%)
- Precise mode
- Total allocated
- 1,584,242,808 bytes [1.48GiB]
- Total wasted
- 480,081,834 bytes [457.84MiB], 30.3%
- Wasted due to objects that should use a bin of:
- 128 bytes
- 480,000,000 bytes [457.76MiB] (99.98%, 99.98% cumulative)
- 256 bytes
- 190 bytes (0%, 99.98% cumulative)
- 512 bytes
- 176 bytes (0%, 99.98% cumulative)
- more than a page
- 81,468 bytes [79.56KiB] (0.02%)
mcore allocation pattern
This is program that test the contention produced by the GC when appending to (thread-specific) arrays in several threads concurrently (again, found at the D NG). For this analysis the concurrency doesn't play any role though, is just a program that do a lot of appending to a few arrays.
Here are the graphic results:


This is the most boring of the examples, as everything works as expected =)
You can clearly see how the arrays grow, passing through each bin size and finally becoming big objects which take most of the allocated space. Almost nothing need to be scanned (they are int arrays), and practically there is no waste. That's a good decision by the array allocation algorithm, which seems to exploit the bin sizes to the maximum. Since almost all the data is doesn't need to be scanned, there is no need to store the type information pointers, so there is no waste either for the precise mode (the story would be totally different if the arrays were of objects that should be scanned, as probably each array allocation would waste about 50% of the memory to store the type information pointer).
Here is the detailed summary:
- Requested
- Total requested
- 367 objecs, 320,666,378 bytes [305.81MiB]
- Scanned
- 8 (2.18%) objecs, 2,019 bytes [1.97KiB] (0%)
- Not scanned
- 359 (97.82%) objecs, 320,664,359 bytes [305.81MiB] (100%)
- Different object sizes
- 278
- Objects requested with a bin size of
- 16 bytes
- 4 (1.09%) objects, 20 bytes (0%)
- 32 bytes
- 5 (1.36%, 2.45% cumulative) objects, 85 bytes (0%, 0% cumulative)
- 64 bytes
- 4 (1.09%, 3.54% cumulative) objects, 132 bytes (0%, 0% cumulative)
- 128 bytes
- 4 (1.09%, 4.63% cumulative) objects, 260 bytes (0%, 0% cumulative)
- 256 bytes
- 6 (1.63%, 6.27% cumulative) objects, 838 bytes (0%, 0% cumulative)
- 512 bytes
- 9 (2.45%, 8.72% cumulative) objects, 2,708 bytes [2.64KiB] (0%, 0% cumulative)
- 1024 bytes
- 4 (1.09%, 9.81% cumulative) objects, 2,052 bytes [2KiB] (0%, 0% cumulative)
- 2048 bytes
- 4 (1.09%, 10.9% cumulative) objects, 4,100 bytes [4KiB] (0%, 0% cumulative)
- 4096 bytes
- 4 (1.09%, 11.99% cumulative) objects, 8,196 bytes [8KiB] (0%, 0.01% cumulative)
- more than a page
- 323 (88.01%) objects, 320,647,987 bytes [305.79MiB] (99.99%)
- Allocated
- Conservative mode
- Total allocated
- 321,319,494 bytes [306.43MiB]
- Total wasted
- 653,116 bytes [637.81KiB], 0.2%
- Wasted due to objects that should use a bin of
- 16 bytes
- 44 bytes (0.01%)
- 32 bytes
- 75 bytes (0.01%, 0.02% cumulative)
- 64 bytes
- 124 bytes (0.02%, 0.04% cumulative)
- 128 bytes
- 252 bytes (0.04%, 0.08% cumulative)
- 256 bytes
- 698 bytes (0.11%, 0.18% cumulative)
- 512 bytes
- 1,900 bytes [1.86KiB] (0.29%, 0.47% cumulative)
- 1024 bytes
- 2,044 bytes [2KiB] (0.31%, 0.79% cumulative)
- 2048 bytes
- 4,092 bytes [4KiB] (0.63%, 1.41% cumulative)
- 4096 bytes
- 8,188 bytes [8KiB] (1.25%, 2.67% cumulative)
- more than a page
- 635,699 bytes [620.8KiB] (97.33%)
- Precise mode
- Total allocated
- 321,319,494 bytes [306.43MiB]
- Total wasted
- 653,116 bytes [637.81KiB], 0.2%
- Wasted due to objects that should use a bin of
- 16 bytes
- 44 bytes (0.01%)
- 32 bytes
- 75 bytes (0.01%, 0.02% cumulative)
- 64 bytes
- 124 bytes (0.02%, 0.04% cumulative)
- 128 bytes
- 252 bytes (0.04%, 0.08% cumulative)
- 256 bytes
- 698 bytes (0.11%, 0.18% cumulative)
- 512 bytes
- 1,900 bytes [1.86KiB] (0.29%, 0.47% cumulative)
- 1024 bytes
- 2,044 bytes [2KiB] (0.31%, 0.79% cumulative)
- 2048 bytes
- 4,092 bytes [4KiB] (0.63%, 1.41% cumulative)
- 4096 bytes
- 8,188 bytes [8KiB] (1.25%, 2.67% cumulative)
- more than a page
- 635,699 bytes [620.8KiB] (97.33%)
voronoi allocation pattern
This is one of my favourites, because is always problematic. It "computes the voronoi diagram of a set of points recursively on the tree" and is also taken from the Olden Benchmark and translated by Leonardo Maffi to D.
Here are the graphic results for a run with -n 30000:


This have a little from all the previous examples. Practically all the heap should be scanned (as in bigarr), it wastes a considerably portion of the heap because of the fixed-size blocks (as all but mcore), it wastes just a very little more because of type information (as all but bh) but that waste comes from objects that should fit in a 16 bytes bin but is stored in a 32 bytes bin instead (as in bh).
Maybe that's why it's problematic, it touches a little mostly all the GC flaws.
Here is the detailed summary:
- Requested
- Total requested
- 1,309,638 objecs, 33,772,881 bytes [32.21MiB]
- Scanned
- 1,309,636 (100%) objecs, 33,772,849 bytes [32.21MiB] (100%)
- Not scanned
- 2 (0%) objecs, 32 bytes (0%)
- Different object sizes
- 6
- Objects requested with a bin size of
- 16 bytes
- 49,152 (3.75%) objects, 786,432 bytes [768KiB] (2.33%)
- 32 bytes
- 1,227,715 (93.74%, 97.5% cumulative) objects, 31,675,047 bytes [30.21MiB] (93.79%, 96.12% cumulative)
- 64 bytes
- 32,768 (2.5%, 100% cumulative) objects, 1,310,720 bytes [1.25MiB] (3.88%, 100% cumulative)
- 256 bytes
- 2 (0%, 100% cumulative) objects, 346 bytes (0%, 100% cumulative)
- 512 bytes
- 1 (0%, 100% cumulative) objects, 336 bytes (0%, 100% cumulative)
- Allocated
- Conservative mode
- Total allocated
- 42,171,488 bytes [40.22MiB]
- Total wasted
- 8,398,607 bytes [8.01MiB], 19.92%
- Wasted due to objects that should use a bin of
- 16 bytes
- 0 bytes (0%)
- 32 bytes
- 7,611,833 bytes [7.26MiB] (90.63%, 90.63% cumulative)
- 64 bytes
- 786,432 bytes [768KiB] (9.36%, 100% cumulative)
- 256 bytes
- 166 bytes (0%, 100% cumulative)
- 512 bytes
- 176 bytes (0%, 100% cumulative)
- Precise mode
- Total allocated
- 42,957,888 bytes [40.97MiB]
- Total wasted
- 9,185,007 bytes [8.76MiB], 21.38%
- Wasted due to objects that should use a bin of
- 16 bytes
- 786,400 bytes [767.97KiB] (8.56%)
- 32 bytes
- 7,611,833 bytes [7.26MiB] (82.87%, 91.43% cumulative)
- 64 bytes
- 786,432 bytes [768KiB] (8.56%, 100% cumulative)
- 256 bytes
- 166 bytes (0%, 100% cumulative)
- 512 bytes
- 176 bytes (0%, 100% cumulative)
Dil allocation pattern
Finally, this is by far my favourite, the only real-life program, and the most colorful example (literally =).
Dil is a D compiler, and as such, it works a lot with strings, a lot of big chunks of memory, a lot of small objects, it has it all! String manipulation stress the GC a lot, because it uses objects (blocks) of all possible sizes ever, specially extremely small objects (less than 8 bytes, even a lot of blocks of just one byte!).
Here are the results of a run of Dil to generate Tango documentation (around 555 source files are processed):


Didn't I say it was colorful?
This is like the voronoi but taken to the extreme, it really have it all, it allocates all types of objects in significant quantities, it wastes a lot of memory (23%) and much more when used in precise mode (33%).
Here is the detailed summary:
- Requested
- Total
- 7,307,686 objecs, 322,411,081 bytes [307.48MiB]
- Scanned
- 6,675,124 (91.34%) objecs, 227,950,157 bytes [217.39MiB] (70.7%)
- Not scanned
- 632,562 (8.66%) objecs, 94,460,924 bytes [90.08MiB] (29.3%)
- Different object sizes
- 6,307
- Objects requested with a bin size of
- 16 bytes
- 2,476,688 (33.89%) objects, 15,693,576 bytes [14.97MiB] (4.87%)
- 32 bytes
- 3,731,864 (51.07%, 84.96% cumulative) objects, 91,914,815 bytes [87.66MiB] (28.51%, 33.38% cumulative)
- 64 bytes
- 911,016 (12.47%, 97.43% cumulative) objects, 41,918,888 bytes [39.98MiB] (13%, 46.38% cumulative)
- 128 bytes
- 108,713 (1.49%, 98.91% cumulative) objects, 8,797,572 bytes [8.39MiB] (2.73%, 49.11% cumulative)
- 256 bytes
- 37,900 (0.52%, 99.43% cumulative) objects, 6,354,323 bytes [6.06MiB] (1.97%, 51.08% cumulative)
- 512 bytes
- 22,878 (0.31%, 99.75% cumulative) objects, 7,653,461 bytes [7.3MiB] (2.37%, 53.45% cumulative)
- 1024 bytes
- 7,585 (0.1%, 99.85% cumulative) objects, 4,963,029 bytes [4.73MiB] (1.54%, 54.99% cumulative)
- 2048 bytes
- 3,985 (0.05%, 99.9% cumulative) objects, 5,451,493 bytes [5.2MiB] (1.69%, 56.68% cumulative)
- 4096 bytes
- 2,271 (0.03%, 99.93% cumulative) objects, 6,228,433 bytes [5.94MiB] (1.93%, 58.61% cumulative)
- more than a page
- 4,786 (0.07%) objects, 133,435,491 bytes [127.25MiB] (41.39%)
- Allocated
- Conservative mode
- Total allocated
- 419,368,774 bytes [399.94MiB]
- Total wasted
- 96,957,693 bytes [92.47MiB], 23.12%
- Wasted due to objects that should use a bin of
- 16 bytes
- 23,933,432 bytes [22.82MiB] (24.68%)
- 32 bytes
- 27,504,833 bytes [26.23MiB] (28.37%, 53.05% cumulative)
- 64 bytes
- 16,386,136 bytes [15.63MiB] (16.9%, 69.95% cumulative)
- 128 bytes
- 5,117,692 bytes [4.88MiB] (5.28%, 75.23% cumulative)
- 256 bytes
- 3,348,077 bytes [3.19MiB] (3.45%, 78.68% cumulative)
- 512 bytes
- 4,060,075 bytes [3.87MiB] (4.19%, 82.87% cumulative)
- 1024 bytes
- 2,804,011 bytes [2.67MiB] (2.89%, 85.76% cumulative)
- 2048 bytes
- 2,709,787 bytes [2.58MiB] (2.79%, 88.56% cumulative)
- 4096 bytes
- 3,073,583 bytes [2.93MiB] (3.17%, 91.73% cumulative)
- more than a page
- 8,020,067 bytes [7.65MiB] (8.27%)
- Precise mode:
- Total allocated
- 482,596,774 bytes [460.24MiB]
- Total wasted
- 160,185,693 bytes [152.76MiB], 33.19%
- Wasted due to objects that should use a bin of
- 16 bytes
- 26,820,824 bytes [25.58MiB] (16.74%)
- 32 bytes
- 85,742,913 bytes [81.77MiB] (53.53%, 70.27% cumulative)
- 64 bytes
- 18,070,872 bytes [17.23MiB] (11.28%, 81.55% cumulative)
- 128 bytes
- 5,221,884 bytes [4.98MiB] (3.26%, 84.81% cumulative)
- 256 bytes
- 3,400,557 bytes [3.24MiB] (2.12%, 86.93% cumulative)
- 512 bytes
- 4,125,611 bytes [3.93MiB] (2.58%, 89.51% cumulative)
- 1024 bytes
- 2,878,763 bytes [2.75MiB] (1.8%, 91.31% cumulative)
- 2048 bytes
- 2,760,987 bytes [2.63MiB] (1.72%, 93.03% cumulative)
- 4096 bytes
- 3,143,215 bytes [3MiB] (1.96%, 94.99% cumulative)
- more than a page
- 8,020,067 bytes [7.65MiB] (5.01%)
Conclusion
I've analyzed other small fabricated benchmarks, but all of them had results very similar to the ones shown here.
I think the overallocation problem is more serious than what one might think at first sight. Bear in mind this is not GC overhead, is not because of internal GC data. Is memory the GC or the mutator cannot use. Is memory wasted because of fragmentation (planned fragmentation, but fragmentation at least). And I don't think this is the worse problem. The worse problem is, this memory will need to be scanned in most cases (Dil needs to scan 70% of the total memory requested), and maybe the worse of all is that is subject to false pointer. A false pointer to a memory location that is not actually being used by the program will keep the block alive! If is a large object (several pages) that could be pretty nasty.
This problems can be addressed in several ways. One is mitigate the problem by checking (when type information is available) what portions of the memory is really used and what is wasted, and don't keep things alive when they are only pointed to wasted memory. This is not free though, it will consume more CPU cycles so the solution could be worse than the problem.
I think it worth experimenting with other heap organizations, for example, I would experiment with one free list for object size instead of pre-fixed-sizes. I would even experiment with a free list for each type when type information is available, that would save a lot of space (internal GC space) when storing type information. Some specialization for strings could be useful too.
Unfortunately I don't think I'll have the time to do this, at least for the thesis, but I think is a very rich and interesting ground to experiment.
Type information at the end of the block considered harmful
by Leandro Lucarella on 2010- 08- 07 17:24 (updated on 2010- 08- 09 13:22)- with 0 comment(s)
Yes, I know I'm not Dijkstra, but I always wanted to do a considered harmful essay =P
And I'm talking about a very specific issue, so this will probably a boring reading for most people :)
This is about my research in D garbage collection, the CDGC, and related to a recent post and the precise heap scanning patch.
I've been playing with the patch for a couple of weeks now, and even when some of the tests in my benchmark became more stable, other tests had the inverse effect, and other tests even worsen their performance.
The extra work done by the patch should not be too significant compared with the work it avoids by no scanning things that are no pointers, so the performance, intuitively speaking, should be considerably increased for test that have a lot of false pointers and for the other tests, at least not be worse or less stable. But that was not what I observed.
I finally got to investigate this issue, and found out that when the precise version was clearly slower than the Tango basic collector, it was due to a difference in the number of collections triggered by the test. Sometimes a big difference, and sometimes with a lot of variation. The number usually never approached to the best value achieved by the basic collector.
For example, the voronoi test with N = 30_000, the best run with the basic collector triggered about 60 collections, varying up to 90, while the precise scanning triggered about 80, with very little variation. Even more, if I ran the tests using setarch to avoid heap addresses randomization (see the other post for details), the basic collector triggered about 65 collections always, while the precise collector still triggered 80, so there was something wrong with the precise scanning independently of the heap addresses.
So the suspicions I had about storing the type information pointer at the end of the block being the cause of the problem became even more suspicious. So I added an option to make the precise collector conservative. The collection algorithm, that changed between collectors, was untouched, the precise collector just don't store the type information when is configured in conservative mode, so it scans all the memory as if it didn't had type information. The results where almost the same as the basic collector, so the problem really was the space overhead of storing the type information in the same blocks the mutator stores it's data.
It looks like the probability of keeping blocks alive incorrectly because of false pointer, even when they came just from the static data and the stack (and other non-precise types, like unions) is increased significantly because of the larger blocks.
The I tried to strip the programs (all the test were using programs with debug info to ease the debugging when I brake the GC :), and the number of collections decreased considerably in average, and the variation between runs too. So it looks like that in the scanned static data are included the debug symbols or there is something else adding noise. This for both precise and conservative scanning, but the effect is worse with precise scanning. Running the programs without heap address randomization (setarch -R), usually decreases the number of collections and the variance too.
Finally, I used a very naïve (but easy) way of storing the type information pointers outside the GC scanned blocks, wasting 25% of space just to store this information (as explained in a comment to the bug report), but I insist, that overhead is outside the GC scanned blocks, unlike the small overhead imposed by storing a pointer at the end of that blocks. Even with such high memory overhead, the results were surprising, the voronoi number of collections doing precise scanning dropped to about 68 (very stable) and the total runtime was a little smaller than the best basic GC times, which made less collections (and were more unstable between runs).
Note that there are still several test that are worse for the CDGC (most notably Dil, the only real-life application :), there are plenty of changes between both collectors and I still didn't look for the causes.
I'll try to experiment with a better way of storing the type information pointers outside the GC blocks, probably using a hash table.
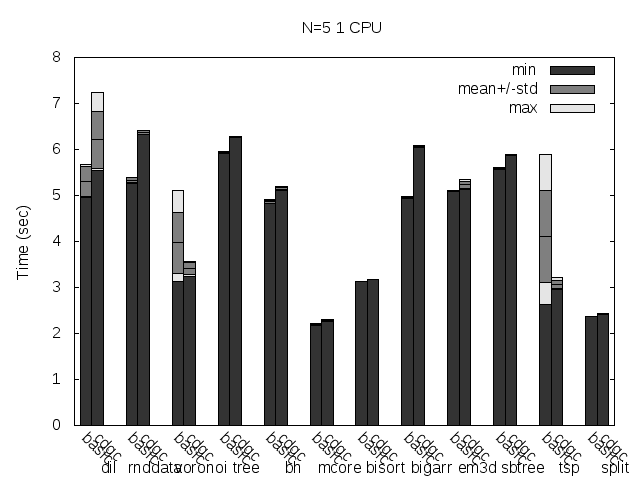
At last but not least, here are some figures (basic is the Tango basic collector, cdgc is the CDGC collector with the specified modifications):
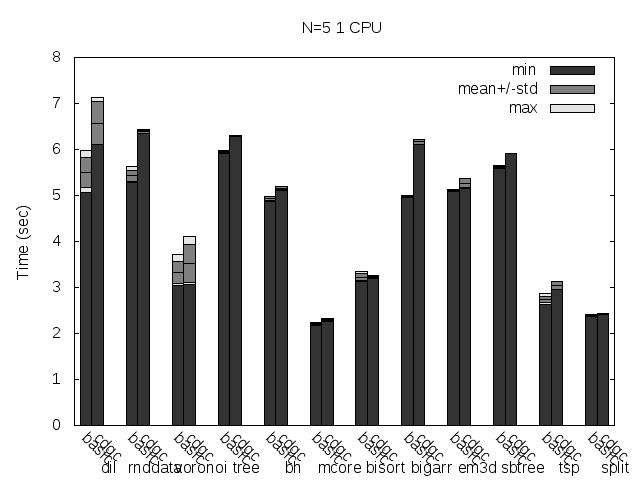
Precise scanning patch doing conservative scanning (not storing the type information at all).
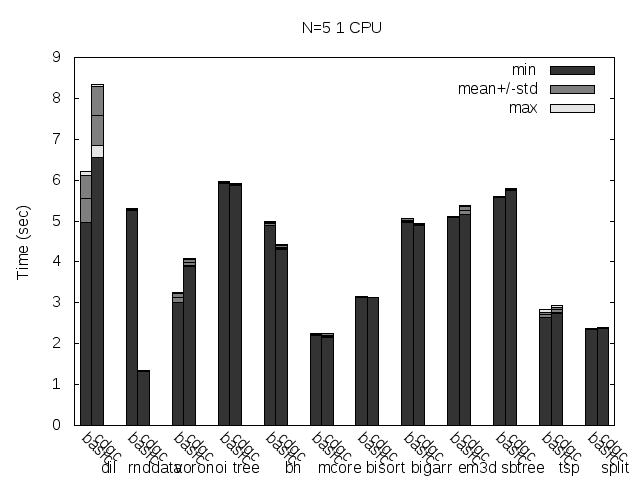
Precise scanning storing the type information at the end of the GC blocks.
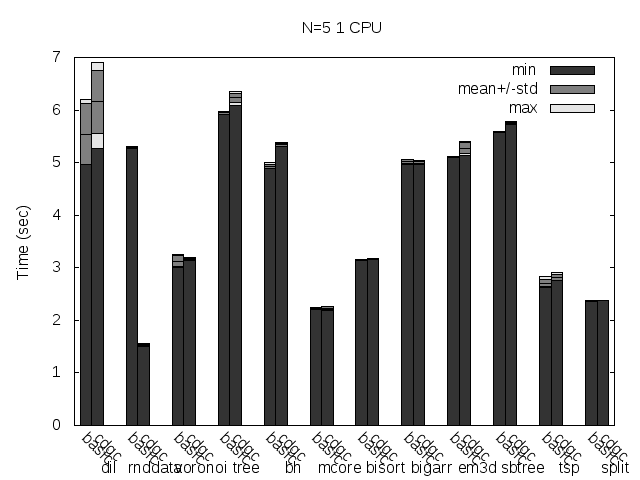
Precise scanning storing the type information outside the GC blocks.
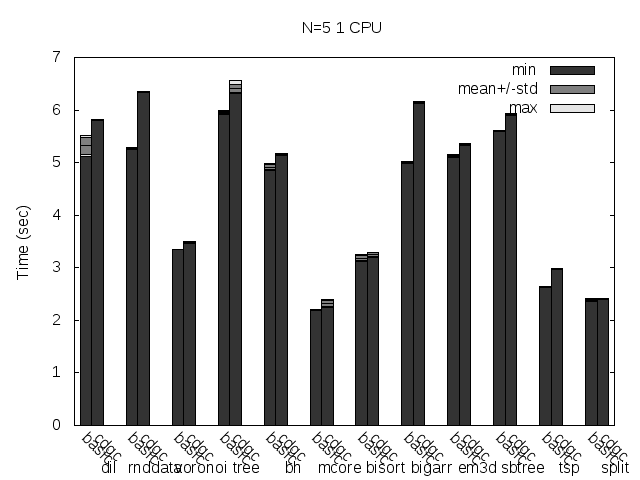
Here are the same tests, but with the binaries stripped:
Precise scanning patch doing conservative scanning (not storing the type information at all). Stripped.

Precise scanning storing the type information at the end of the GC blocks. Stripped.

Precise scanning storing the type information outside the GC blocks. Stripped.
Here are the same tests as above, but disabling Linux heap addresses randomization (setarch -R):
Precise scanning patch doing conservative scanning (not storing the type information at all). Stripped. No addresses randomization.

Precise scanning storing the type information at the end of the GC blocks. Stripped. No addresses randomization.
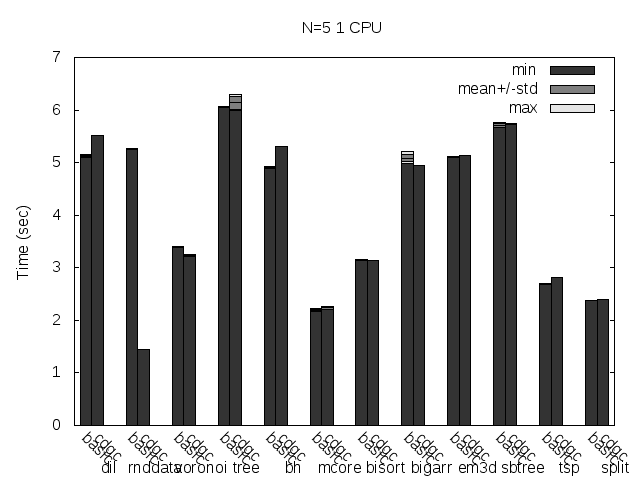
Precise scanning storing the type information outside the GC blocks. Stripped. No addresses randomization.
Update
I noticed that the plots doesn't always reflect 100% what's stated in the text, that is because the text was written with another run results and it seems like the tested programs are very sensitive to the heap and binary addresses the kernel assign to the program.
Anyway, what you can see in the plots very clear is how stripping the binaries changes the results a lot and how the performance is particularly improved when storing the type information pointer outside the GC'ed memory when the binaries are not stripped.
Presenting CDGC
by Leandro Lucarella on 2010- 07- 28 21:48 (updated on 2010- 07- 28 21:48)- with 0 comment(s)
I've just published the git repository of my D GC implementation: CDGC. The name stands for Concurrent D Garbage Collector but right now you may call it Configurable D Garbage Collector, as there is no concurrency at all yet, but the GC is configurable via environment variables :)
It's based on the Tango (0.99.9) basic GC, there are only few changes at the moment, probably the bigger ones are:
- Runtime configurability using environment variables.
- Logging of malloc()s and collections to easily get stats about time and space consumed by the GC (option malloc_stats_file [str] and collect_stats_file [str]).
- Precise heap scanning based on the patches published in bug 3463 (option conservative [bool]).
- Runtime configurable debug features (option mem_stomp [bool] and sentinel [bool]).
- Other non user-visible cleanups.
The configuration is done via the D_GC_OPTS environment variable, and the format is:
D_GC_OPTS=opt1=value:opt2=value:bool_opt:opt3=value
Where opt1, opt2, opt3 and bool_opt are option names and value is their respective values. Boolean options can omit the value (which means true) or use a value of 0 or 1 to express false and true respectively. String options have no limitations, except they can't have the : char in their values and they have a maximum value length (255 at this moment).
At the moment is a little slower than the Tango basic GC, because the precise scanning is done very naively and a lot of calls to findPool() are done. This will change in the future.
There is a lot of work to be done (cleanup, optimization and the concurrent part :), but I'm making it public because maybe someone could want to adapt some of the ideas or follow the development.