Toshiba Satellite/Portege Z830/R830 frequency lock (and BIOS upgrade)
by Leandro Lucarella on 2012- 11- 28 23:21 (updated on 2012- 11- 28 23:21)- with 0 comment(s)
Fuck! I bought this extremely nice ultrabook, the Toshiba Satellite Z830-10J, about an year ago, and I've been experiencing some problems with CPU frequency scaling.
At one point I looked and looked for kernel bugs without much success. I went through several kernel updates in the hope of this being fixed, but never happened.
It seemed that the problem wasn't so bad after all, because I only got the CPU frequency locked down to the minimum when using the ondemand scaling governor, but the conservative was working apparently OK.
Just a little more latency I thought, is not that bad.
Recently I received an update on a related bug and I thought about giving it another shot. This mentioned something about booting with processor.ignore_ppc=1 to ignore some BIOS warning about temperature to overcome some faulty BIOS, so I thought on trying that.
But before doing, if this were a real BIOS problem, I thought about looking for some BIOS update. And there was one. The European Toshiba website offered only a Windows program to do the update though, but fortunately I found in a forum a suggestion about using the non-European BIOS upgrade instead, which was provided also as an ISO image. The problem is I don't have a CD-ROM, but that shouldn't stop me, I still have USB sticks and hard-drives, how hard could it be? I failed with UNetbootin but quickly found a nice article explaining how to boot an ISO image directly with grub.
BIOS upgraded, problem not fixed. So I was a about to try the kernel parameter when I remembered I saw some other article when googling desperately for answers suggesting changing some BIOS options to fix a similar problem.
So I though about messing with the BIOS first instead. The first option I saw that looked a little suspicious was in:
PowerManagement
   -> BIOS Power Management
      -> Battery Save Mode (using custom settings)
         -> Processor Speed
            <Low>
That is supposed to be only for non-ACPI capable OS, so I thought it shouldn't be a problem, but I tried with <High> instead.
WOW!!!
I start noticing the notebook booting much faster, but I thought maybe it was all in my mind...
But no, then my session opened way faster too, and everything was extremely faster. I think maybe about twice as fast. Everything feels a lot more responsive too. I can't believe I spend almost an year with this performance penalty. FUCKING FAULTY BIOS. I didn't make any battery life comparisons yet, but my guess is everything will go well, because it should still consume very little power when idle.
Anyway, lesson learned:
Less blaming to the kernel, more blaming to the hardware manufacturers.
But I still want to clarify that I love this notebook. I found it a perfect combination between features, weight and battery life, and now that it runs twice as fast (at least in my brain), is even better.
Hope this is useful for someone.
Recursive vs. iterative marking
by Leandro Lucarella on 2010- 08- 30 00:54 (updated on 2010- 08- 30 00:54)- with 0 comment(s)
After a small (but important) step towards making the D GC truly concurrent (which is my main goal), I've been exploring the possibility of making the mark phase recursive instead of iterative (as it currently is).
The motivation is that the iterative algorithm makes several passes through the entire heap (it doesn't need to do the full job on each pass, it processes only the newly reachable nodes found in the previous iteration, but to look for that new reachable node it does have to iterate over the entire heap). The number of passes is the same as the connectivity graph depth, the best case is where all the heap is reachable through the root set, and the worse is when the heap is a single linked list. The recursive algorithm, on the other hand, needs only a single pass but, of course, it has the problem of potentially consuming a lot of stack space (again, the recurse depth is the same as the connectivity graph depth), so it's not paradise either.
To see how much of a problem is the recurse depth in reality, first I've implemented a fully recursive algorithm, and I found it is a real problem, since I had segmentation faults because the (8MiB by default in Linux) stack overflows. So I've implemented an hybrid approach, setting a (configurable) maximum recurse depth for the marking phase. If the maximum depth is reached, the recursion is stopped and nodes that should be scanned deeply than that are queued to scanned in the next iteration.
Here are some results showing how the total run time is affected by the maximum recursion depth:
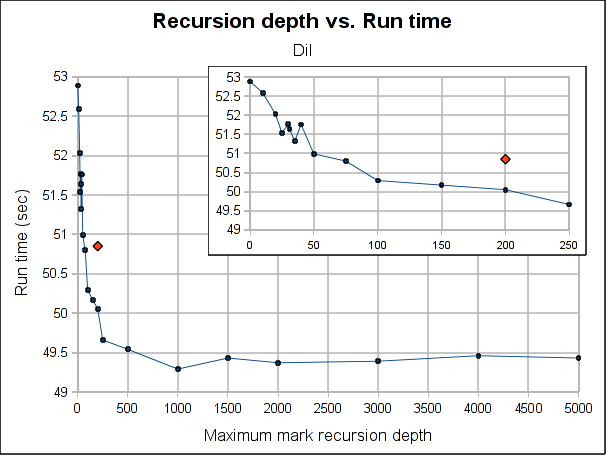
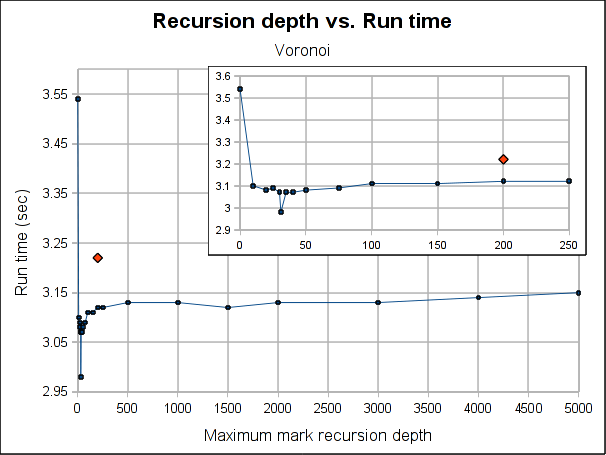
The red dot is how the pure iterative algorithm currently performs (it's placed arbitrarily in the plot, as the X-axis doesn't make sense for it).
The results are not very conclusive. Even when the hybrid approach performs better for both Dil and Voronoi when the maximum depth is bigger than 75, the better depth is program specific. Both have its worse case when depth is 0, which makes sense, because is paying the extra complexity of the hybrid algorithm with using its power. As soon as we leave the 0 depth, a big drop is seen, for Voronoi big enough to outperform the purely iterative algorithm, but not for Dil, which matches it near 60 and clearly outperforms it at 100.
As usual, Voronoi challenges all logic, as the best depth is 31 (it was a consistent result among several runs). Between 20 and 50 there is not much variation (except for the magic number 31) but when going beyond that, it worsen slowly but constantly as the depth is increased.
Note that the plots might make the performance improvement look a little bigger than it really is. The best case scenario the gain is 7.5% for Voronoi and 3% for Dil (which is probably better measure for the real world). If I had to choose a default, I'll probably go with 100 because is where both get a performance gain and is still a small enough number to ensure no segmentation faults due to stack exhaustion is caused (only) by the recursiveness of the mark phase (I guess a value of 1000 would be reasonable too, but I'm a little scared of causing inexplicable, magical, mystery segfaults to users). Anyway, for a value of 100, the performance gain is about 1% and 3.5% for Dil and Voronoi respectively.
So I'm not really sure if I should merge this change or not. In the best case scenarios (which requires a work from the user to search for the better depth for its program), the performance gain is not exactly huge and for a reasonable default value is so little that I'm not convinced the extra complexity of the change (because it makes the marking algorithm a little more complex) worth it.
Feel free to leave your opinion (I would even appreciate it if you do :).
Performance WTF
by Leandro Lucarella on 2010- 07- 14 03:47 (updated on 2010- 07- 25 03:11)- with 0 comment(s)
How do I start describing this problem? Let's try to do it in chronological order...
Introduction
I've collected a bunch of little programs to use as a benchmark suite for the garbage collector for my thesis. I was running only a few manually each time I've made a change to the GC to see how things were going (I didn't want to make changes that degrade the performance). A little tired of this (and missing the point of having several tests using just a few), I've decided to build a Makefile to compile the programs, run the tests and generate some graphs with the timings to compare the performance against the current D GC (Tango really).
The Problem
When done, I noticed a particular test that was notably slower in my implementation (it went from ~3 seconds to ~5 seconds). Here is the result (see the voronoi test, if you can read the labels, there is some overlapping because my effort to improve the graph was truncated by this issue :).

But I didn't recall it being that way when running the test manually. So I ran the test manually again, and it took ~3 seconds, not ~5. So I started to dig where the difference came from. You'll be surprised by my findings, the difference came from executing the tests inside the Makefile!
Yes, take a look at this (please note that I've removed all output from the voronoi program, the only change I've made):
$ /usr/bin/time -f%e ./voronoi -n 30000
3.10
$ echo 'all:' > Makefile
$ echo -e '\t$C' >> Makefile
$ make C="/usr/bin/time -f%e ./voronoi -n 30000"
/usr/bin/time -f%e ./voronoi -n 30000
5.11
$
This is not just one isolated run, I've tried hundreds of runs and the results are reproducible and stable.
Further Investigation
I don't remember exactly how I started, but early enough, noticing that the Tango's basic GC didn't suffered from that problem, and being my GC based on that one, I bisected my repository to see what was introducing such behaviour. The offending patch was removing the difference between committed and uncommitted pages in pools. I can see that this patch could do more harm than good now (I didn't tried the benchmark when I did that change I think), because more pages are looped when working with pools, but I can't see how this would affect only the program when it's executed by Make!!!
I had a patch that made thing really nasty but not a clue why they were nasty. I've tried everything. First, the obvious: use nice and ionice (just in case) to see if I was just being unlucky with the system load (very unlikely since I did hundreds of runs in different moments, but still). No change.
I've tried running it on another box. Mine is a Quad-Core, so I've tried the Dual-Core from work and I had the same problem, only the timing difference were a little smaller (about ~4.4 seconds), so I thought it might be something to do to with the multi-cores, so I've tried it in a single core, but the problem was the same (~10.5 seconds inside make, ~7 outside). I've tried with taskset in the multi-core boxes too. I've tried putting all the CPUs with the performance governor using cpufreq-set too, but didn't help.
Since I'm using DMD, which works only in 32 bits for now, and since my box, and the box at work are both 64 bits, I suspected from that too, but the old AMD is 32 bits and I see the problem there too.
I've tried valgrind + callgrind + kcachegrind but it seems like valgrind emulation is not affected by whatever difference is when the program is ran inside make because the results for the run inside and outside make were almost identical.
I've tried env -i, just in case some weird environment variable was making the difference, but nothing.
I've tried strace too, to see if I spotted anything weird, and I saw a couple of weird things (like the addresses returned by mmap being suspiciously very different), but nothing too concrete (but I think inspecting the strace results more thoughtfully might be one of the most fertile paths to follow). I took a look at the timings of the syscalls and there was nothing taking too much time, most of the time is spent in the programs calculations.
So I'm really lost here. I still have no idea where the difference could come from, and I guess I'll have to run the tests from a separate shell script instead of directly inside make because of this. I'll ask to the make developers about this, my only guess is that maybe make is doing some trickery with the scheduler of something like that for the -j option. And I'll take a look to the offending patch too, to see if the performance was really degraded and maybe I'll revert it if it does, no matter what happen with this issue.
If you have any ideas on what could be going on, anything, please let me know (in a comment of via e-mail). Thanks :)
Update
I've posted this to the Make mailing list, but unfortunately didn't got any useful answer. Thanks anyway to all the people that replied with nice suggestions!
Update
Thanks Alb for the investigation, that was a 1/4kg of ice-cream well earned =P
A couple of notes about his findings. An easy way to trigger this behaviour is using the command setarch, the option -L changes the memory layout to ADDR_COMPAT_LAYOUT, see the commit that introduced the new layout for more details.
The call to setrlimit(RLIMIT_STACK, RLIM_INFINITY) by Make (which has a reason) triggers that behaviour too because the new layout can't have an unlimited stack, so using ulimit (ulimit -s unlimited) causes the same behaviour.
The same way, if you type ulimit -s 8192 ./voronoi as a command in a Makefile, the effect is reverted and the command behaves as outside the Makefile.
Part of the mystery is solved, but a question remains: why the test is so address-space-layout dependant? It smells like a GC bug (present in the basic GC too, as other tests I've done show the same odd behaviour, less visibly, but still, probably because of the removal of the distinction between committed and uncommitted memory patch).
Update
Last update, I promise! =)
I think I know what is adding the extra variance when the memory layout is randomized: false pointers.
Since the GC is conservative, data is usually misinterpreted as pointers. It seems that are address spaces that makes much more likely that simple data is misinterpreted as a valid pointer, at least for the voronoi test. This is consistent with other tests. Tests with random data notably increases their variance among runs and are pretty stable when the memory layout is not randomized.
I'll try to give the patch to integrate precise heap scanning a try, and see if it improves things.
What remains a mystery is what happened with the committed memory distinction, now I can't reproduce the results. I made so many measures and changes, that maybe I just got lost in a bad measure (for example, with the CPU using the ondemand governor). I've tried again the tests with and without that change and the results are pretty the same (a little better for the case with the distinction, but a really tiny difference indeed).
Well, that's all for now, I'll give this post a rest =)
Update
Don't believe me, ever! =P
I just wanted to say that's is confirmed, the high variance in the timings when heap randomization is used is because of false pointers. See this comment for more details.
Delegates and inlining
by Leandro Lucarella on 2010- 06- 28 15:30 (updated on 2010- 06- 28 15:30)- with 0 comment(s)
Sometimes performance issues matter more than you might think for a language. In this case I'm talking about the D programming language.
I'm trying to improve the GC, and I want to improve it not only in terms of performance, but in terms of code quality too. But I'm hitting some performance issues that prevent me to make the code better.
D support high level constructs, like delegates (aka closures). For example, to do a simple linear search I wanted to use this code:
T* find_if(bool delegate(ref T) predicate)
{
   for (size_t i = 0; i < this._size; i++)
      if (predicate(this._data[i]))
         return this._data + i;
   return null;
}
...
auto p = find_if((ref T t) { return t > 5; });
But in DMD, you don't get that predicate inlined (neither the find_if() call, for that matter), so you're basically screwed, suddenly you code is ~4x slower. Seriously, I'm not joking, using callgrind to profile the program (DMD's profiler doesn't work for me, I get a stack overflow for a recursive call when I try to use it), doing the call takes 4x more instructions, and in a real life example, using Dil to generate the Tango documentation, I get a 3.3x performance penalty for using this high-level construct.
I guess this is why D2's sort uses string mixins instead of delegates for this kind of things. The only lectures that I can find from this is delegates are failing in D, either because they have a bad syntax (compare sort(x, (ref X a, ref X b) { return a > b; }) with sort!"a < b"(x)) or because their performance sucks (mixins are inlined by definition, think of C macros). The language designer is telling you "don't use that feature".
Fortunately the later is only a DMD issue, LDC is able to inline those predicates (they have to inhibit the DMD front-end inlining to let LLVM do the dirty work, and it definitely does it better).
The problem is I can't use LDC because for some unknown reason it produces a non-working Dil executable, and Dil is the only real-life program I have to test and benchmark the GC.
I think this issue really hurts D, because if you can't write performance critical code using higher-level D constructs, you can't showcase your own language in the important parts.