Berlin
by Leandro Lucarella on 2011- 06- 16 16:19 (updated on 2011- 06- 16 16:19)- with 0 comment(s)

CDGC merged into Tango
by Leandro Lucarella on 2011- 01- 28 22:49 (updated on 2011- 01- 28 22:49)- with 0 comment(s)
Yai! Finally my CDGC patches has been applied to Tango [1] [2] [3]. CDGC will not be the default Tango GC for now, because it needs some real testing first (and fixing a race when using weak references). So, please, please, do try it, is as simple as compiling from the sources adding a new option to bob: -g=cdgc and then manually installing Tango.
Please, don't forget to report any bugs or problems.
Thanks!
Engineer
by Leandro Lucarella on 2010- 12- 08 21:33 (updated on 2010- 12- 08 21:33)- with 0 comment(s)
Finally, I defended my thesis last Monday and now I'm officially (well, not really, the diploma takes about a year to be emitted) an Ingeniero en Informática (something like a Informatics Engineer). I hope I can get some free time now to polish the rough edges of the collector (fix the weakrefs for example) so it can be finally merged into Tango.
Día D
by Leandro Lucarella on 2010- 11- 30 22:31 (updated on 2010- 11- 30 22:31)- with 3 comment(s)
Finalmente, luego de más de una década de carrera (no voy a decir estudio porque de estudio fue bastante menos :), me recibo. Defiendo la tesis el lunes 6 a las 19:30 horas en el aula 402 de FIUBA y dejo el planito solo porque a alguna gente le resultó gracioso (por lo que me siento muy insultado).
Por si algún extra-terrestre está interesado en el tema, les dejo el abstract:
El manejo de memoria es un problema recurrente en los lenguajes de programación; dada su complejidad es muy propenso a errores y las consecuencias de dichos errores pueden ser muy graves. La recolección de basura es el área de investigación que trata las técnicas de manejo automático de memoria. D es un lenguaje de programación compilado, con tipado estático y multi-paradigma que combina el poder de lenguajes de programación de bajo nivel, como C, con la facilidad de los de alto nivel, como Python o Java. D provee recolección de basura pero ha sido frecuentemente criticada por sus varias falencias. Dadas las particularidades del lenguaje, plantea un desafío casi único en cuanto al diseño de un recolector.
Este trabajo hace un recorrido por el estado del arte en recolección de basura teniendo en cuenta los requerimientos de D; analiza la implementación del recolector actual y propone mejoras con el objetivo principal de minimizar los tiempos de pausa. Finalmente se construye un banco de pruebas para verificar los resultados, que muestran una disminución de hasta 200 veces en el tiempo de pausa del recolector y de hasta 3 veces en el tiempo total de ejecución.
CDGC experimental branch in Druntime
by Leandro Lucarella on 2010- 11- 09 18:51 (updated on 2010- 11- 09 18:51)- with 0 comment(s)
Sean Kelly just created a new experimental branch in Druntime with CDGC as the GC for D2. The new branch is completely untested though, so only people wanting to help testing should try it out (which will be very appreciated).
CDGC Tango integration
by Leandro Lucarella on 2010- 10- 21 02:34 (updated on 2010- 10- 21 02:34)- with 0 comment(s)
Trying CDGC HOWTO
by Leandro Lucarella on 2010- 10- 10 19:28 (updated on 2010- 10- 10 19:28)- with 0 comment(s)
Here are some details on how to try CDGC, as it needs a very particular setup, specially due to DMD not having precise heap scanning integrated yet.
Here are the steps (in some kind of literate scripting, you can copy&paste to a console ;)
# You probably want to do all this mess in some subdirectory :)
mkdir cdgc-test
cd cdgc-test

# First, checkout the repositories.
git clone git://git.llucax.com/software/dgc/cdgc.git
# If you have problems with git:// URLs, try HTTP:
# git clone https://git.llucax.com/r/software/dgc/cdgc.git
svn co http://svn.dsource.org/projects/tango/tags/releases/0.99.9 tango

# DMD doesn't care much (as usual) about tags, so you have to use -r to
# checkout the 1.063 revision (you might be good with the latest revision
# too).
svn co -r613 http://svn.dsource.org/projects/dmd/branches/dmd-1.x dmd

# Now we have to do some patching, let's start with Tango (only patch 3 is
# *really* necessary, but the others won't hurt).
cd tango
for p in 0001-Fixes-to-be-able-to-parse-the-code-with-Dil.patch \
         0002-Use-the-mutexattr-when-initializing-the-mutex.patch \
         0003-Add-precise-heap-scanning-support.patch \
         0004-Use-the-right-attributes-when-appending-to-an-empty-.patch
do
   wget -O- "https://llucax.com/blog/posts/2010/10/10-trying-cdgc-howto/$p" |
         patch -p1
done
cd ..

# Now let's go to DMD
cd dmd
p=0001-Create-pointer-map-bitmask-to-allow-precise-heap-sca.patch
wget -O- "https://llucax.com/blog/posts/2010/10/10-trying-cdgc-howto/$p" |
      patch -p1

# Since we are in the DMD repo, let's compile it (you may want to add -jN if
# you have N CPUs to speed up things a little).
make -C src -f linux.mak
cd ..

# Good, now we have to wire Tango and CDGC together, just create a symbolic
# link:
cd tango
ln -s ../../../../../cdgc/rt/gc/cdgc tango/core/rt/gc/

# Since I don't know very well the Tango build system, I did a Makefile of my
# own to compile it, so just grab it and compile Tango with it. It will use
# the DMD you just compiled and will compile CDGC by default (you can change
# it via the GC Make variable, for example: make GC=basic to compile Tango
# with the basic GC). The library will be written to obj/libtango-$GC.a, so
# you can have both CDGB and the basic collector easily at hand):
wget https://llucax.com/blog/posts/2010/10/10-trying-cdgc-howto/Makefile
make # Again add -jN if you have N CPUs to make a little faster

# Now all you need now is a decent dmd.conf to put it all together:
cd ..
echo "[Environment]" > dmd/src/dmd.conf
echo -n "DFLAGS=-I$PWD/tango -L-L$PWD/tango/obj " >> dmd/src/dmd.conf
echo -n "-defaultlib=tango-cdgc " >> dmd/src/dmd.conf
echo "-debuglib=tango-cdgc -version=Tango" >> dmd/src/dmd.conf

# Finally, try a Hello World:
cat <<EOT > hello.d
import  tango.io.Console;

void main()
{
   Cout("Hello, World").newline;
}
EOT
dmd/src/dmd -run hello.d

# If you don't trust me and you want to be completely sure you have CDGC
# running, try the collect_stats_file option to generate a log of the
# collections:
D_GC_OPTS=collect_stats_file=log dmd/src/dmd -run hello.d
cat log
Done!
If you want to make this DMD the default, just add dmd/src to the PATH environment variable or do a proper installation ;)
Let me know if you hit any problem...
CDGC done
by Leandro Lucarella on 2010- 09- 28 15:16 (updated on 2010- 09- 28 15:16)- with 0 comment(s)
I'm sorry about the quick and uninformative post, but I've been almost 2 weeks without Internet and I have to finish the first complete draft of my thesis in a little more than a week, so I don't have much time to write here.
The thing is, to avoid the nasty effect of memory usage being too high for certain programs when using eager allocation, I've made the GC minimize the heap more often. Even when some test are still a little slower with CDGC, but that's only for tests that only stress the GC without doing any actual work, so I think it's OK, in that cases the extra overhead of being concurrent is bigger than the gain (which is inexistent, because there is nothing to do in parallel with the collector).
Finally, I've implemented early collection, which didn't proved very useful, and tried to keep a better occupancy factor of the heap with the new min_free option, without much success either (it looks like the real winner was eager allocation).
I'm sorry I don't have time to show you some graphs this time. Of course the work is not really finished, there are plenty of things to be done still, but I think the GC have come to a point where it can be really useful, and I have to finish my thesis :)
After I'm done, I hope I can work on integrating the GC in Tango and/or Druntime (where there is already a first approach done by Sean Kelly).
Truly concurrent GC using eager allocation
by Leandro Lucarella on 2010- 09- 10 03:01 (updated on 2010- 09- 10 03:01)- with 0 comment(s)
Finally, I got the first version of CDGC with truly concurrent garbage collection, in the sense that all the threads of the mutator (the program itself) can run in parallel with the collector (well, only the mark phase to be honest :).
You might want to read a previous post about CDGC where I achieved some sort of concurrency by making only the stop-the-world time very short, but the thread that triggered the collection (and any other thread needing any GC service) had to wait until the collection finishes. The thread that triggered the collection needed to wait for the collection to finish to fulfill the memory allocation request (it was triggered because the memory was exhausted), while any other thread needing any GC service needed to acquire the global GC lock (damn global GC lock!).
To avoid this issue, I took a simple approach that I call eager allocation, consisting on spawn the mark phase concurrently but allocating a new memory pool to be able to fulfill the memory request instantly. Doing so, not only the thread that triggered the collection can keep going without waiting the collection to finish, the global GC lock is released and any other thread can use any GC service, and even allocate more memory, since a new pool was allocated.
If the memory is exhausted again before the collection finishes, a new pool is allocated, so everything can keep running. The obvious (bad) consequence of this is potential memory bloat. Since the memory usage is minimized from time to time, this effect should not be too harmful though, but let's see the results, there are plenty of things to analyze from them (a lot not even related to concurrency).
First, a couple of comments about the plots:
- Times of Dil are multiplied by a factor of 0.1 in all the plots, times of rnddata are too, but only in the pause time and stop-the-world plots. This is only to make the plots more readable.
- The unreadable labels rotated 45 degrees say: stw, fork and ea. Those stand for Stop-the-world (the basic collector), fork only (concurrent but without eager allocation) and eager allocation respectively. You can click on the images to see a little more readable SVG version.
- The plots are for one CPU-only because using more CPUs doesn't change much (for these plots).
- The times were taken from a single run, unlike the total run time plots I usually post. Since a single run have multiple collections, the information about min, max, average and standard deviation still applies for the single run.
- Stop-the-world time is the time no mutator thread can run. This is not related to the global GC lock, is time the threads are really really paused (this is even necessary for the forking GC to take a snapshot of threads CPU registers and stacks). So, the time no mutator thread can do any useful work might be much bigger than this time, because the GC lock. This time is what I call Pause time. The maximum pause time is probably the most important variable for a GC that tries to minimize pauses, like this one. Is the maximum time a program will stay totally unresponsive (important for a server, a GUI application, a game or any interactive application).

The stop-the-world time is reduced so much that you can hardly see the times of the fork and ea configuration. It's reduced in all tests by a big margin, except for mcore and the bigarr. For the former it was even increased a little, for the later it was reduced but very little (but only for the ea* configuration, so it might be a bad measure). This is really measuring the Linux fork() time. When the program manages so little data that the mark phase itself is so fast that's faster than a fork(), this is what happens. The good news is, the pause times are small enough for those cases, so no harm is done (except from adding a little more total run time to the program).
Note the Dil maximum stop-the-world time, it's 0.2 seconds, looks pretty big, uh? Well, now remember that this time was multiplied by 0.1, the real maximum stop-the-world for Dil is 2 seconds, and remember this is the minimum amount of time the program is unresponsive! Thank god it's not an interactive application :)
Time to take a look to the real pause time:

OK, this is a little more confusing... The only strong pattern is that pause time is not changed (much) between the swt and fork configurations. This seems to make sense, as both configurations must wait for the whole collection to finish (I really don't know what's happening with the bh test).
For most tests (7), the pause time is much smaller for the ea configuration, 3 tests have much bigger times for it, one is bigger but similar (again mcore) and then is the weird case of bh. The 7 tests where the time is reduced are the ones that seems to make sense, that's what I was looking for, so let's see what's happening with the remaining 3, and for that, let's take a look at the amount of memory the program is using, to see if the memory bloat of allocating extra pools is significant.
| Test | Maximum heap size (MB) | ||
|---|---|---|---|
| Program | stw | ea | ea/stw |
| dil | 216 | 250 | 1.16 |
| rnddata | 181 | 181 | 1 |
| voronoi | 16 | 30 | 1.88 |
| tree | 7 | 114 | 16.3 |
| bh | 80 | 80 | 1 |
| mcore | 30 | 38 | 1.27 |
| bisort | 30 | 30 | 1 |
| bigarr | 11 | 223 | 20.3 |
| em3d | 63 | 63 | 1 |
| sbtree | 11 | 122 | 11.1 |
| tsp | 63 | 63 | 1 |
| split | 39 | 39 | 1 |
See any relations between the plot and the table? I do. It looks like some programs are not being able to minimize the memory usage, and because of that, the sweep phase (which still have to run in a mutator thread, taking the global GC lock) is taking ages. An easy to try approach is to trigger the minimization of the memory usage not only at when big objects are allocated (like it is now), but that could lead to more mmap()/munmap()s than necessary. And there still problems with pools that are kept alive because a very small object is still alive, which is not solved by this.
So I think a more long term solution would be to introduce what I call early collection too. Meaning, trigger a collection before the memory is exhausted. That would be the next step in the CDGC.
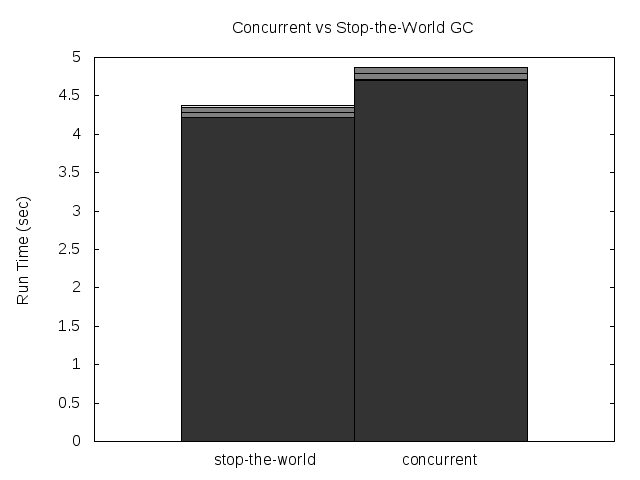
Finally, let's take a look at the total run time of the test programs using the basic GC and CDGC with concurrent marking and eager allocation. This time, let's see what happens with 2 CPUs (and 25 runs):

Wow! It looks like this is getting really juicy (with exceptions, as usual :)! Dil time is reduced to about 1/3, voronoi is reduced to 1/10!!! Split and mcore have both their time considerably reduced, but that's because another small optimization (unrelated to what we are seeing today), so forget about those two. Same for rnddata, which is reduced because of precise heap scanning. But other tests increased its runtime, most notably bigarr takes almost double the time. Looking at the maximum heap size table, one can find some answers for this too. Another ugly side of early allocation.
For completeness, let's see what happens with the number of collections triggered during the program's life. Here is the previous table with this new data added:
| Test | Maximum heap size (MB) | Number of collections | ||||
|---|---|---|---|---|---|---|
| Program | stw | ea | ea/stw | stw | ea | ea/stw |
| dil | 216 | 250 | 1.16 | 62 | 50 | 0.81 |
| rnddata | 181 | 181 | 1 | 28 | 28 | 1 |
| voronoi | 16 | 30 | 1.88 | 79 | 14 | 0.18 |
| tree | 7 | 114 | 16.3 | 204 | 32 | 0.16 |
| bh | 80 | 80 | 1 | 27 | 27 | 1 |
| mcore | 30 | 38 | 1.27 | 18 | 14 | 0.78 |
| bisort | 30 | 30 | 1 | 10 | 10 | 1 |
| bigarr | 11 | 223 | 20.3 | 305 | 40 | 0.13 |
| em3d | 63 | 63 | 1 | 14 | 14 | 1 |
| sbtree | 11 | 122 | 11.1 | 110 | 33 | 0.3 |
| tsp | 63 | 63 | 1 | 14 | 14 | 1 |
| split | 39 | 39 | 1 | 7 | 7 | 1 |
See how the number of collections is practically reduced proportionally to the increase of the heap size. When the increase in size explodes, even when the number of collections is greatly reduced, the sweep time take over and the total run time is increased. Specially in those tests where the program is almost only using the GC (as in sbtree and bigarr). That's why I like the most Dil and voronoi as key tests, they do quite a lot of real work beside asking for memory or using other GC services.
This confirms that the performance gain is not strictly related to the added concurrency, but because of a nice (finally! :) side-effect of eager allocation: removing some pressure from the GC by increasing the heap size a little (Dil gets 3x boost in run time for as little as 1.16x of memory usage; voronoi gets 10x at the expense of almost doubling the heap, I think both are good trade-offs). This shows another weak point of the GC, sometimes the HEAP is way too tight, triggering a lot of collections, which leads to a lot of GC run time overhead. Nothing is done right now to keep a good heap occupancy ratio.
But is there any real speed (in total run time terms) improvement because of the added concurrency? Let's see the run time for 1 CPU:

It looks like there is, specially for my two favourite tests: both Dil and voronoi get a 30% speed boost! That's not bad, not bad at all...
If you want to try it, the repository has been updated with this last changes :). If you do, please let me know how it went.
Recursive vs. iterative marking
by Leandro Lucarella on 2010- 08- 30 00:54 (updated on 2010- 08- 30 00:54)- with 0 comment(s)
After a small (but important) step towards making the D GC truly concurrent (which is my main goal), I've been exploring the possibility of making the mark phase recursive instead of iterative (as it currently is).
The motivation is that the iterative algorithm makes several passes through the entire heap (it doesn't need to do the full job on each pass, it processes only the newly reachable nodes found in the previous iteration, but to look for that new reachable node it does have to iterate over the entire heap). The number of passes is the same as the connectivity graph depth, the best case is where all the heap is reachable through the root set, and the worse is when the heap is a single linked list. The recursive algorithm, on the other hand, needs only a single pass but, of course, it has the problem of potentially consuming a lot of stack space (again, the recurse depth is the same as the connectivity graph depth), so it's not paradise either.
To see how much of a problem is the recurse depth in reality, first I've implemented a fully recursive algorithm, and I found it is a real problem, since I had segmentation faults because the (8MiB by default in Linux) stack overflows. So I've implemented an hybrid approach, setting a (configurable) maximum recurse depth for the marking phase. If the maximum depth is reached, the recursion is stopped and nodes that should be scanned deeply than that are queued to scanned in the next iteration.
Here are some results showing how the total run time is affected by the maximum recursion depth:
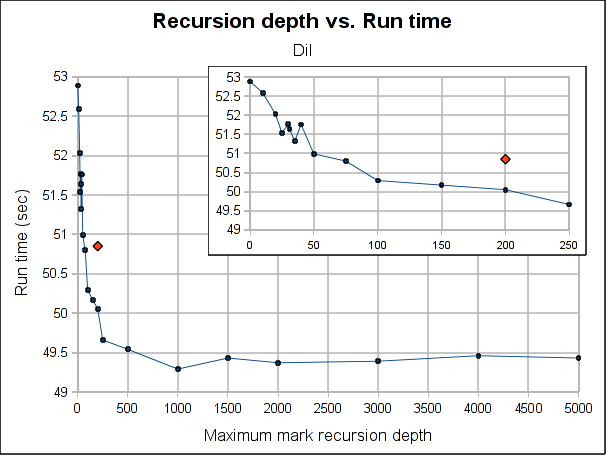
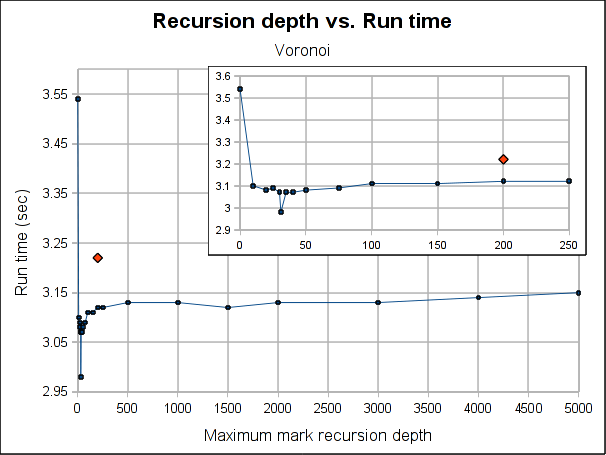
The red dot is how the pure iterative algorithm currently performs (it's placed arbitrarily in the plot, as the X-axis doesn't make sense for it).
The results are not very conclusive. Even when the hybrid approach performs better for both Dil and Voronoi when the maximum depth is bigger than 75, the better depth is program specific. Both have its worse case when depth is 0, which makes sense, because is paying the extra complexity of the hybrid algorithm with using its power. As soon as we leave the 0 depth, a big drop is seen, for Voronoi big enough to outperform the purely iterative algorithm, but not for Dil, which matches it near 60 and clearly outperforms it at 100.
As usual, Voronoi challenges all logic, as the best depth is 31 (it was a consistent result among several runs). Between 20 and 50 there is not much variation (except for the magic number 31) but when going beyond that, it worsen slowly but constantly as the depth is increased.
Note that the plots might make the performance improvement look a little bigger than it really is. The best case scenario the gain is 7.5% for Voronoi and 3% for Dil (which is probably better measure for the real world). If I had to choose a default, I'll probably go with 100 because is where both get a performance gain and is still a small enough number to ensure no segmentation faults due to stack exhaustion is caused (only) by the recursiveness of the mark phase (I guess a value of 1000 would be reasonable too, but I'm a little scared of causing inexplicable, magical, mystery segfaults to users). Anyway, for a value of 100, the performance gain is about 1% and 3.5% for Dil and Voronoi respectively.
So I'm not really sure if I should merge this change or not. In the best case scenarios (which requires a work from the user to search for the better depth for its program), the performance gain is not exactly huge and for a reasonable default value is so little that I'm not convinced the extra complexity of the change (because it makes the marking algorithm a little more complex) worth it.
Feel free to leave your opinion (I would even appreciate it if you do :).
CDGC first breath
by Leandro Lucarella on 2010- 08- 23 02:03 (updated on 2010- 08- 23 02:03)- with 0 comment(s)
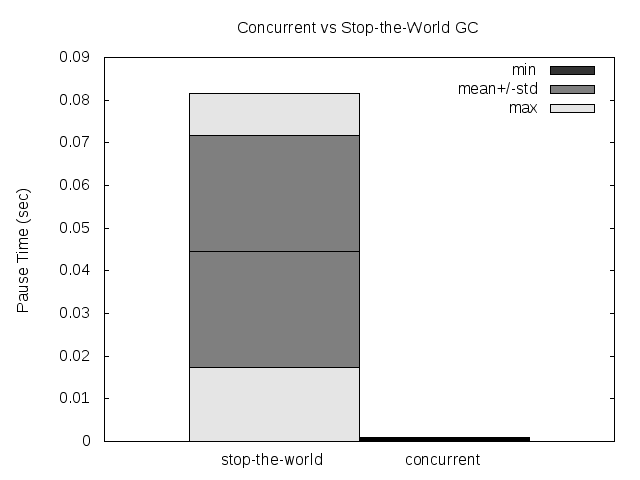
I'm glad to announce that now, for the first time, CDGC means Concurrent D Garbage Collector, as I have my first (extremely raw and unoptimized) version of the concurrent GC running. And I have to say, I'm very excited and happy with the results from the very small benchmark I did.
The stop-the-world (pause) time was reduced by 2 orders of magnitude for the average, the standard deviation and, probably the more important, the maximum (these are the results for a single run, measuring the pause time for all the collections in that run). This is good news for people needing (soft) real-time in D, even when using the GC. Where the standard D GC have a pause time of 100ms, the CDGC have a pause time of 1ms.
The total run-time of the program was increased a little though, but not as much as the pause time was reduced. Only a 12% performance loss was measured, but this is just the first raw unoptimized version of the CDGC.
All this was measured with the voronoi benchmark, with -n 30000. Here are some plots:
Please note that the GC still has a global lock, so if 2 threads needs to allocate while the collection is running, both will be paused anyways (I have a couple of ideas on how to try to avoid that).
The idea about how to make the GC concurrent is based on the paper Nonintrusive Cloning Garbage Collector with Stock Operating System Support. I'm particularly excited by the results because the reduction of the pause time in the original paper were less than 1 order of magnitude better than their stop-the-world collector, so the preliminary results of the CDGC are much better than I expected.
TypeInfo, static data and the GC
by Leandro Lucarella on 2010- 08- 16 00:39 (updated on 2010- 08- 16 00:39)- with 0 comment(s)
The D compiler doesn't provide any information on the static data that the GC must scan, so the runtime/GC have to use OS-dependant tricks to get that information.
Right now, in Linux, the GC gets the static data to scan from the libc's variables __data_start and _end, from which are not much information floating around except for some e-mail from Hans Boehm to the binutils mainling list.
There is a lot of stuff in the static data that doesn't need to be scanned, most notably the TypeInfo, which is a great portion of the static data. C libraries static data, for example, would be scanned too, when it makes no sense to do so.
I noticed CDGC has more than double the static data the basic GC has, just because of TypeInfo (I use about 5 or so more types, one of them is a template, which makes the bloat bigger).
The voronoi test goes from 21KB to 26KB of static data when using CDGC.
It would be nice if the compiler could group all the static that must really be scanned (programs static variables) together and make its limits available to the GC. It would be even nicer to leave static variables that have no pointers out of that group, and even much more nicer to create a pointer map like the one in the patch for precise scanning to allow precise heap scanning. Then only the scan should be scanned in full conservative mode.
I reported a bug with this issue so it doesn't get lost.
Memory allocation patterns
by Leandro Lucarella on 2010- 08- 14 06:28 (updated on 2010- 08- 14 16:09)- with 0 comment(s)
Note
Tango 0.99.9 has a bug in its runtime, which sometimes makes the GC scan memory that should not be scanned. It only affects Dil and Voronoi programs, but in a significant way. The tests in this post are done using a patched runtime, with the bug fixed.
Update
The results for the unpublished programs are now available. You can find the graphic results, the detailed summary and the source code for all the programs (except dil, which can be downloaded from its home site).
After seeing some weird behaviours and how different benchmarks are more or less affected by changes like memory addresses returned by the OS or by different ways to store the type information pointer, I decided to gather some information about how much and what kind of memory are requested by the different benchmarks.
I used the information provided by the malloc_stats_file CDGC option, and generated some stats.
The analysis is done on the allocations requested by the program (calls to gc_malloc()) and contrasting that with the real memory allocated by the GC. Note that only the GC heap memory (that is, memory dedicated to the program, which the GC scans in the collections) is counted (internal GC memory used for bookkeeping is not).
Also note that in this post I generally refer to object meaning a block of memory, it doesn't mean they are actually instance of a class or anything. Finally bear in mind that all the figures shown here are the sum of all the allocations done in the life of a program. If the collected data says a program requested 1GiB of memory, that doesn't mean the program had a residency of 1GiB, the program could had a working set of a few KiB and recycled memory like hell.
When analyzing the real memory allocated by the GC, there are two modes being analyzed, one is the classic conservative mode and the other is the precise mode (as it is in the original patch, storing the type information pointer at the end of the blocks). So the idea here is to measure two major things:
- The amount of memory wasted by the GC because of how it arranges memory as fixed-size blocks (bins) and large objects that uses whole pages.
- The extra amount of memory wasted by the GC when using precise mode because it stores the type information pointer at the end of the blocks.
I've selected a few representative benchmarks. Here are the results:
bh allocation pattern
This is a translation by Leonardo Maffi from the Olden Benchmark that does a Barnes–Hut simulation. The program is CPU intensive an does a lot of allocation of about 5 different small objects.
Here is a graphic summary of the allocation requests and real allocated memory for a run with -b 4000:


We can easily see here how the space wasted by the GC memory organization is significant (about 15% wasted), and how the type information pointer is adding an even more significant overhead (about 36% of the memory is wasted). This means that this program will be 15% more subject to false pointers (and will have to scan some extra memory too, but fortunately the majority of the memory doesn't need to be scanned) than it should in conservative mode and that the precise mode makes things 25% worse.
You can also see how the extra overhead in the precise mode is because some objects that should fit in a 16 bin now need a 32 bytes bin to hold the extra pointer. See how there were no waste at all in the conservative mode for objects that should fit a 16 bytes bin. 117MiB are wasted because of that.
Here is a more detailed (but textual) summary of the memory requested and allocated:
- Requested
- Total
- 15,432,462 objecs, 317,236,335 bytes [302.54MiB]
- Scanned
- 7,757,429 (50.27%) objecs, 125,360,510 bytes [119.55MiB] (39.52%)
- Not scanned
- 7,675,033 (49.73%) objecs, 191,875,825 bytes [182.99MiB] (60.48%)
- Different object sizes
- 8
- Objects requested with a bin size of:
- 16 bytes
- 7,675,064 (49.73%) objects, 122,801,024 bytes [117.11MiB] (38.71%)
- 32 bytes
- 7,734,214 (50.12%, 99.85% cumulative) objects, 193,609,617 bytes [184.64MiB] (61.03%, 99.74% cumulative)
- 64 bytes
- 23,181 (0.15%, 100% cumulative) objects, 824,988 bytes [805.65KiB] (0.26%, 100% cumulative)
- 256 bytes
- 2 (0%, 100% cumulative) objects, 370 bytes (0%, 100% cumulative)
- 512 bytes
- 1 (0%, 100% cumulative) objects, 336 bytes (0%, 100% cumulative)
- Allocated
- Conservative mode
- Total allocated
- 371,780,480 bytes [354.56MiB]
- Total wasted
- 54,544,145 bytes [52.02MiB], 14.67%
- Wasted due to objects that should use a bin of
- 16 bytes
- 0 bytes (0%)
- 32 bytes
- 53,885,231 bytes [51.39MiB] (98.79%, 98.79% cumulative)
- 64 bytes
- 658,596 bytes [643.16KiB] (1.21%, 100% cumulative)
- 256 bytes
- 142 bytes (0%, 100% cumulative)
- 512 bytes
- 176 bytes (0%, 100% cumulative)
- Precise mode
- Total allocated
- 495,195,296 bytes [472.26MiB]
- Total wasted
- 177,958,961 bytes [169.71MiB], 35.94%
- Wasted due to objects that should use a bin of
- 16 bytes
- 122,801,024 bytes [117.11MiB] (69.01%)
- 32 bytes
- 54,499,023 bytes [51.97MiB] (30.62%, 99.63% cumulative)
- 64 bytes
- 658,596 bytes [643.16KiB] (0.37%, 100% cumulative)
- 256 bytes
- 142 bytes (0%, 100% cumulative)
- 512 bytes
- 176 bytes (0%, 100% cumulative)
bigarr allocation pattern
This is a extremely simple program that just allocate a big array of small-medium objects (all of the same size) I found in the D NG.
Here is the graphic summary:


The only interesting part of this test is how many space is wasted because of the memory organization, which in this case goes up to 30% for the conservative mode (and have no change for the precise mode).
Here is the detailed summary:
- Requested
- Total
- 12,000,305 objecs, 1,104,160,974 bytes [1.03GiB]
- Scanned
- 12,000,305 (100%) objecs, 1,104,160,974 bytes [1.03GiB] (100%)
- Not scanned
- 0 (0%) objecs, 0 bytes (0%)
- Different object sizes
- 5
- Objects requested with a bin size of
- 128 bytes
- 12,000,000 (100%, 100% cumulative) objects, 1,056,000,000 bytes [1007.08MiB] (95.64%, 95.64% cumulative)
- 256 bytes
- 2 (0%, 100% cumulative) objects, 322 bytes (0%, 95.64% cumulative)
- 512 bytes
- 1 (0%, 100% cumulative) objects, 336 bytes (0%, 95.64% cumulative)
- more than a page
- 302 (0%) objects, 48,160,316 bytes [45.93MiB] (4.36%)
- Allocated
- Conservative mode
- Total allocated
- 1,584,242,808 bytes [1.48GiB]
- Total wasted
- 480,081,834 bytes [457.84MiB], 30.3%
- Wasted due to objects that should use a bin of
- 128 bytes
- 480,000,000 bytes [457.76MiB] (99.98%, 99.98% cumulative)
- 256 bytes
- 190 bytes (0%, 99.98% cumulative)
- 512 bytes
- 176 bytes (0%, 99.98% cumulative)
- more than a page
- 81,468 bytes [79.56KiB] (0.02%)
- Precise mode
- Total allocated
- 1,584,242,808 bytes [1.48GiB]
- Total wasted
- 480,081,834 bytes [457.84MiB], 30.3%
- Wasted due to objects that should use a bin of:
- 128 bytes
- 480,000,000 bytes [457.76MiB] (99.98%, 99.98% cumulative)
- 256 bytes
- 190 bytes (0%, 99.98% cumulative)
- 512 bytes
- 176 bytes (0%, 99.98% cumulative)
- more than a page
- 81,468 bytes [79.56KiB] (0.02%)
mcore allocation pattern
This is program that test the contention produced by the GC when appending to (thread-specific) arrays in several threads concurrently (again, found at the D NG). For this analysis the concurrency doesn't play any role though, is just a program that do a lot of appending to a few arrays.
Here are the graphic results:


This is the most boring of the examples, as everything works as expected =)
You can clearly see how the arrays grow, passing through each bin size and finally becoming big objects which take most of the allocated space. Almost nothing need to be scanned (they are int arrays), and practically there is no waste. That's a good decision by the array allocation algorithm, which seems to exploit the bin sizes to the maximum. Since almost all the data is doesn't need to be scanned, there is no need to store the type information pointers, so there is no waste either for the precise mode (the story would be totally different if the arrays were of objects that should be scanned, as probably each array allocation would waste about 50% of the memory to store the type information pointer).
Here is the detailed summary:
- Requested
- Total requested
- 367 objecs, 320,666,378 bytes [305.81MiB]
- Scanned
- 8 (2.18%) objecs, 2,019 bytes [1.97KiB] (0%)
- Not scanned
- 359 (97.82%) objecs, 320,664,359 bytes [305.81MiB] (100%)
- Different object sizes
- 278
- Objects requested with a bin size of
- 16 bytes
- 4 (1.09%) objects, 20 bytes (0%)
- 32 bytes
- 5 (1.36%, 2.45% cumulative) objects, 85 bytes (0%, 0% cumulative)
- 64 bytes
- 4 (1.09%, 3.54% cumulative) objects, 132 bytes (0%, 0% cumulative)
- 128 bytes
- 4 (1.09%, 4.63% cumulative) objects, 260 bytes (0%, 0% cumulative)
- 256 bytes
- 6 (1.63%, 6.27% cumulative) objects, 838 bytes (0%, 0% cumulative)
- 512 bytes
- 9 (2.45%, 8.72% cumulative) objects, 2,708 bytes [2.64KiB] (0%, 0% cumulative)
- 1024 bytes
- 4 (1.09%, 9.81% cumulative) objects, 2,052 bytes [2KiB] (0%, 0% cumulative)
- 2048 bytes
- 4 (1.09%, 10.9% cumulative) objects, 4,100 bytes [4KiB] (0%, 0% cumulative)
- 4096 bytes
- 4 (1.09%, 11.99% cumulative) objects, 8,196 bytes [8KiB] (0%, 0.01% cumulative)
- more than a page
- 323 (88.01%) objects, 320,647,987 bytes [305.79MiB] (99.99%)
- Allocated
- Conservative mode
- Total allocated
- 321,319,494 bytes [306.43MiB]
- Total wasted
- 653,116 bytes [637.81KiB], 0.2%
- Wasted due to objects that should use a bin of
- 16 bytes
- 44 bytes (0.01%)
- 32 bytes
- 75 bytes (0.01%, 0.02% cumulative)
- 64 bytes
- 124 bytes (0.02%, 0.04% cumulative)
- 128 bytes
- 252 bytes (0.04%, 0.08% cumulative)
- 256 bytes
- 698 bytes (0.11%, 0.18% cumulative)
- 512 bytes
- 1,900 bytes [1.86KiB] (0.29%, 0.47% cumulative)
- 1024 bytes
- 2,044 bytes [2KiB] (0.31%, 0.79% cumulative)
- 2048 bytes
- 4,092 bytes [4KiB] (0.63%, 1.41% cumulative)
- 4096 bytes
- 8,188 bytes [8KiB] (1.25%, 2.67% cumulative)
- more than a page
- 635,699 bytes [620.8KiB] (97.33%)
- Precise mode
- Total allocated
- 321,319,494 bytes [306.43MiB]
- Total wasted
- 653,116 bytes [637.81KiB], 0.2%
- Wasted due to objects that should use a bin of
- 16 bytes
- 44 bytes (0.01%)
- 32 bytes
- 75 bytes (0.01%, 0.02% cumulative)
- 64 bytes
- 124 bytes (0.02%, 0.04% cumulative)
- 128 bytes
- 252 bytes (0.04%, 0.08% cumulative)
- 256 bytes
- 698 bytes (0.11%, 0.18% cumulative)
- 512 bytes
- 1,900 bytes [1.86KiB] (0.29%, 0.47% cumulative)
- 1024 bytes
- 2,044 bytes [2KiB] (0.31%, 0.79% cumulative)
- 2048 bytes
- 4,092 bytes [4KiB] (0.63%, 1.41% cumulative)
- 4096 bytes
- 8,188 bytes [8KiB] (1.25%, 2.67% cumulative)
- more than a page
- 635,699 bytes [620.8KiB] (97.33%)
voronoi allocation pattern
This is one of my favourites, because is always problematic. It "computes the voronoi diagram of a set of points recursively on the tree" and is also taken from the Olden Benchmark and translated by Leonardo Maffi to D.
Here are the graphic results for a run with -n 30000:


This have a little from all the previous examples. Practically all the heap should be scanned (as in bigarr), it wastes a considerably portion of the heap because of the fixed-size blocks (as all but mcore), it wastes just a very little more because of type information (as all but bh) but that waste comes from objects that should fit in a 16 bytes bin but is stored in a 32 bytes bin instead (as in bh).
Maybe that's why it's problematic, it touches a little mostly all the GC flaws.
Here is the detailed summary:
- Requested
- Total requested
- 1,309,638 objecs, 33,772,881 bytes [32.21MiB]
- Scanned
- 1,309,636 (100%) objecs, 33,772,849 bytes [32.21MiB] (100%)
- Not scanned
- 2 (0%) objecs, 32 bytes (0%)
- Different object sizes
- 6
- Objects requested with a bin size of
- 16 bytes
- 49,152 (3.75%) objects, 786,432 bytes [768KiB] (2.33%)
- 32 bytes
- 1,227,715 (93.74%, 97.5% cumulative) objects, 31,675,047 bytes [30.21MiB] (93.79%, 96.12% cumulative)
- 64 bytes
- 32,768 (2.5%, 100% cumulative) objects, 1,310,720 bytes [1.25MiB] (3.88%, 100% cumulative)
- 256 bytes
- 2 (0%, 100% cumulative) objects, 346 bytes (0%, 100% cumulative)
- 512 bytes
- 1 (0%, 100% cumulative) objects, 336 bytes (0%, 100% cumulative)
- Allocated
- Conservative mode
- Total allocated
- 42,171,488 bytes [40.22MiB]
- Total wasted
- 8,398,607 bytes [8.01MiB], 19.92%
- Wasted due to objects that should use a bin of
- 16 bytes
- 0 bytes (0%)
- 32 bytes
- 7,611,833 bytes [7.26MiB] (90.63%, 90.63% cumulative)
- 64 bytes
- 786,432 bytes [768KiB] (9.36%, 100% cumulative)
- 256 bytes
- 166 bytes (0%, 100% cumulative)
- 512 bytes
- 176 bytes (0%, 100% cumulative)
- Precise mode
- Total allocated
- 42,957,888 bytes [40.97MiB]
- Total wasted
- 9,185,007 bytes [8.76MiB], 21.38%
- Wasted due to objects that should use a bin of
- 16 bytes
- 786,400 bytes [767.97KiB] (8.56%)
- 32 bytes
- 7,611,833 bytes [7.26MiB] (82.87%, 91.43% cumulative)
- 64 bytes
- 786,432 bytes [768KiB] (8.56%, 100% cumulative)
- 256 bytes
- 166 bytes (0%, 100% cumulative)
- 512 bytes
- 176 bytes (0%, 100% cumulative)
Dil allocation pattern
Finally, this is by far my favourite, the only real-life program, and the most colorful example (literally =).
Dil is a D compiler, and as such, it works a lot with strings, a lot of big chunks of memory, a lot of small objects, it has it all! String manipulation stress the GC a lot, because it uses objects (blocks) of all possible sizes ever, specially extremely small objects (less than 8 bytes, even a lot of blocks of just one byte!).
Here are the results of a run of Dil to generate Tango documentation (around 555 source files are processed):


Didn't I say it was colorful?
This is like the voronoi but taken to the extreme, it really have it all, it allocates all types of objects in significant quantities, it wastes a lot of memory (23%) and much more when used in precise mode (33%).
Here is the detailed summary:
- Requested
- Total
- 7,307,686 objecs, 322,411,081 bytes [307.48MiB]
- Scanned
- 6,675,124 (91.34%) objecs, 227,950,157 bytes [217.39MiB] (70.7%)
- Not scanned
- 632,562 (8.66%) objecs, 94,460,924 bytes [90.08MiB] (29.3%)
- Different object sizes
- 6,307
- Objects requested with a bin size of
- 16 bytes
- 2,476,688 (33.89%) objects, 15,693,576 bytes [14.97MiB] (4.87%)
- 32 bytes
- 3,731,864 (51.07%, 84.96% cumulative) objects, 91,914,815 bytes [87.66MiB] (28.51%, 33.38% cumulative)
- 64 bytes
- 911,016 (12.47%, 97.43% cumulative) objects, 41,918,888 bytes [39.98MiB] (13%, 46.38% cumulative)
- 128 bytes
- 108,713 (1.49%, 98.91% cumulative) objects, 8,797,572 bytes [8.39MiB] (2.73%, 49.11% cumulative)
- 256 bytes
- 37,900 (0.52%, 99.43% cumulative) objects, 6,354,323 bytes [6.06MiB] (1.97%, 51.08% cumulative)
- 512 bytes
- 22,878 (0.31%, 99.75% cumulative) objects, 7,653,461 bytes [7.3MiB] (2.37%, 53.45% cumulative)
- 1024 bytes
- 7,585 (0.1%, 99.85% cumulative) objects, 4,963,029 bytes [4.73MiB] (1.54%, 54.99% cumulative)
- 2048 bytes
- 3,985 (0.05%, 99.9% cumulative) objects, 5,451,493 bytes [5.2MiB] (1.69%, 56.68% cumulative)
- 4096 bytes
- 2,271 (0.03%, 99.93% cumulative) objects, 6,228,433 bytes [5.94MiB] (1.93%, 58.61% cumulative)
- more than a page
- 4,786 (0.07%) objects, 133,435,491 bytes [127.25MiB] (41.39%)
- Allocated
- Conservative mode
- Total allocated
- 419,368,774 bytes [399.94MiB]
- Total wasted
- 96,957,693 bytes [92.47MiB], 23.12%
- Wasted due to objects that should use a bin of
- 16 bytes
- 23,933,432 bytes [22.82MiB] (24.68%)
- 32 bytes
- 27,504,833 bytes [26.23MiB] (28.37%, 53.05% cumulative)
- 64 bytes
- 16,386,136 bytes [15.63MiB] (16.9%, 69.95% cumulative)
- 128 bytes
- 5,117,692 bytes [4.88MiB] (5.28%, 75.23% cumulative)
- 256 bytes
- 3,348,077 bytes [3.19MiB] (3.45%, 78.68% cumulative)
- 512 bytes
- 4,060,075 bytes [3.87MiB] (4.19%, 82.87% cumulative)
- 1024 bytes
- 2,804,011 bytes [2.67MiB] (2.89%, 85.76% cumulative)
- 2048 bytes
- 2,709,787 bytes [2.58MiB] (2.79%, 88.56% cumulative)
- 4096 bytes
- 3,073,583 bytes [2.93MiB] (3.17%, 91.73% cumulative)
- more than a page
- 8,020,067 bytes [7.65MiB] (8.27%)
- Precise mode:
- Total allocated
- 482,596,774 bytes [460.24MiB]
- Total wasted
- 160,185,693 bytes [152.76MiB], 33.19%
- Wasted due to objects that should use a bin of
- 16 bytes
- 26,820,824 bytes [25.58MiB] (16.74%)
- 32 bytes
- 85,742,913 bytes [81.77MiB] (53.53%, 70.27% cumulative)
- 64 bytes
- 18,070,872 bytes [17.23MiB] (11.28%, 81.55% cumulative)
- 128 bytes
- 5,221,884 bytes [4.98MiB] (3.26%, 84.81% cumulative)
- 256 bytes
- 3,400,557 bytes [3.24MiB] (2.12%, 86.93% cumulative)
- 512 bytes
- 4,125,611 bytes [3.93MiB] (2.58%, 89.51% cumulative)
- 1024 bytes
- 2,878,763 bytes [2.75MiB] (1.8%, 91.31% cumulative)
- 2048 bytes
- 2,760,987 bytes [2.63MiB] (1.72%, 93.03% cumulative)
- 4096 bytes
- 3,143,215 bytes [3MiB] (1.96%, 94.99% cumulative)
- more than a page
- 8,020,067 bytes [7.65MiB] (5.01%)
Conclusion
I've analyzed other small fabricated benchmarks, but all of them had results very similar to the ones shown here.
I think the overallocation problem is more serious than what one might think at first sight. Bear in mind this is not GC overhead, is not because of internal GC data. Is memory the GC or the mutator cannot use. Is memory wasted because of fragmentation (planned fragmentation, but fragmentation at least). And I don't think this is the worse problem. The worse problem is, this memory will need to be scanned in most cases (Dil needs to scan 70% of the total memory requested), and maybe the worse of all is that is subject to false pointer. A false pointer to a memory location that is not actually being used by the program will keep the block alive! If is a large object (several pages) that could be pretty nasty.
This problems can be addressed in several ways. One is mitigate the problem by checking (when type information is available) what portions of the memory is really used and what is wasted, and don't keep things alive when they are only pointed to wasted memory. This is not free though, it will consume more CPU cycles so the solution could be worse than the problem.
I think it worth experimenting with other heap organizations, for example, I would experiment with one free list for object size instead of pre-fixed-sizes. I would even experiment with a free list for each type when type information is available, that would save a lot of space (internal GC space) when storing type information. Some specialization for strings could be useful too.
Unfortunately I don't think I'll have the time to do this, at least for the thesis, but I think is a very rich and interesting ground to experiment.
Type information at the end of the block considered harmful
by Leandro Lucarella on 2010- 08- 07 17:24 (updated on 2010- 08- 09 13:22)- with 0 comment(s)
Yes, I know I'm not Dijkstra, but I always wanted to do a considered harmful essay =P
And I'm talking about a very specific issue, so this will probably a boring reading for most people :)
This is about my research in D garbage collection, the CDGC, and related to a recent post and the precise heap scanning patch.
I've been playing with the patch for a couple of weeks now, and even when some of the tests in my benchmark became more stable, other tests had the inverse effect, and other tests even worsen their performance.
The extra work done by the patch should not be too significant compared with the work it avoids by no scanning things that are no pointers, so the performance, intuitively speaking, should be considerably increased for test that have a lot of false pointers and for the other tests, at least not be worse or less stable. But that was not what I observed.
I finally got to investigate this issue, and found out that when the precise version was clearly slower than the Tango basic collector, it was due to a difference in the number of collections triggered by the test. Sometimes a big difference, and sometimes with a lot of variation. The number usually never approached to the best value achieved by the basic collector.
For example, the voronoi test with N = 30_000, the best run with the basic collector triggered about 60 collections, varying up to 90, while the precise scanning triggered about 80, with very little variation. Even more, if I ran the tests using setarch to avoid heap addresses randomization (see the other post for details), the basic collector triggered about 65 collections always, while the precise collector still triggered 80, so there was something wrong with the precise scanning independently of the heap addresses.
So the suspicions I had about storing the type information pointer at the end of the block being the cause of the problem became even more suspicious. So I added an option to make the precise collector conservative. The collection algorithm, that changed between collectors, was untouched, the precise collector just don't store the type information when is configured in conservative mode, so it scans all the memory as if it didn't had type information. The results where almost the same as the basic collector, so the problem really was the space overhead of storing the type information in the same blocks the mutator stores it's data.
It looks like the probability of keeping blocks alive incorrectly because of false pointer, even when they came just from the static data and the stack (and other non-precise types, like unions) is increased significantly because of the larger blocks.
The I tried to strip the programs (all the test were using programs with debug info to ease the debugging when I brake the GC :), and the number of collections decreased considerably in average, and the variation between runs too. So it looks like that in the scanned static data are included the debug symbols or there is something else adding noise. This for both precise and conservative scanning, but the effect is worse with precise scanning. Running the programs without heap address randomization (setarch -R), usually decreases the number of collections and the variance too.
Finally, I used a very naïve (but easy) way of storing the type information pointers outside the GC scanned blocks, wasting 25% of space just to store this information (as explained in a comment to the bug report), but I insist, that overhead is outside the GC scanned blocks, unlike the small overhead imposed by storing a pointer at the end of that blocks. Even with such high memory overhead, the results were surprising, the voronoi number of collections doing precise scanning dropped to about 68 (very stable) and the total runtime was a little smaller than the best basic GC times, which made less collections (and were more unstable between runs).
Note that there are still several test that are worse for the CDGC (most notably Dil, the only real-life application :), there are plenty of changes between both collectors and I still didn't look for the causes.
I'll try to experiment with a better way of storing the type information pointers outside the GC blocks, probably using a hash table.
At last but not least, here are some figures (basic is the Tango basic collector, cdgc is the CDGC collector with the specified modifications):
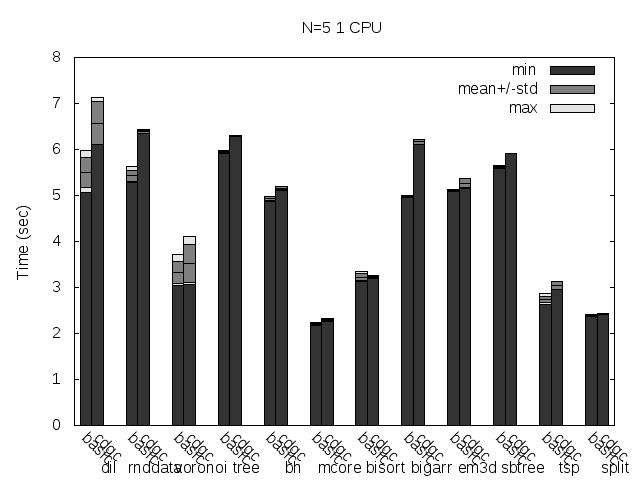
Precise scanning patch doing conservative scanning (not storing the type information at all).
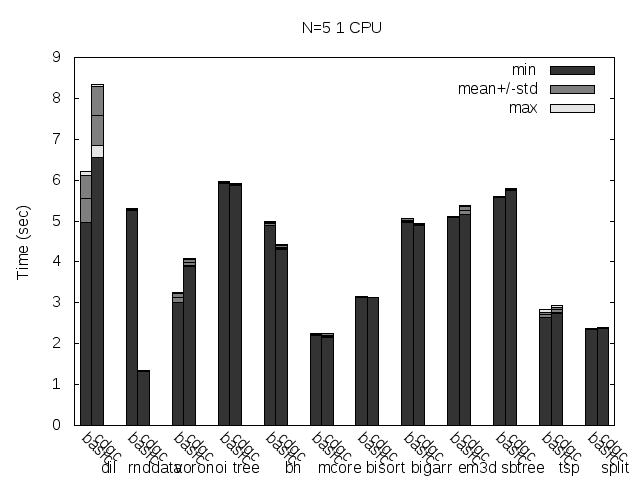
Precise scanning storing the type information at the end of the GC blocks.
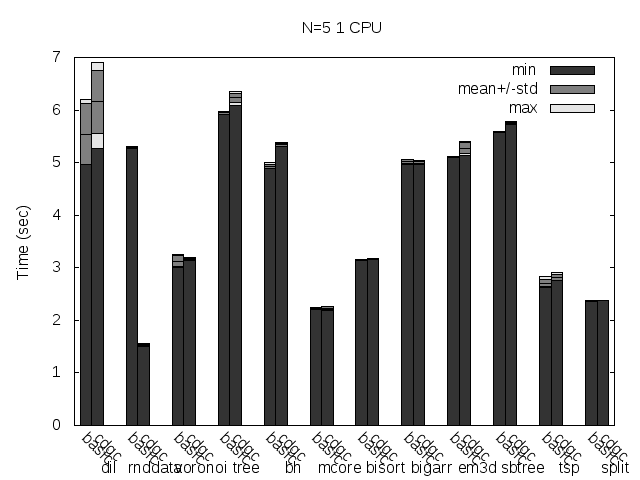
Precise scanning storing the type information outside the GC blocks.
Here are the same tests, but with the binaries stripped:
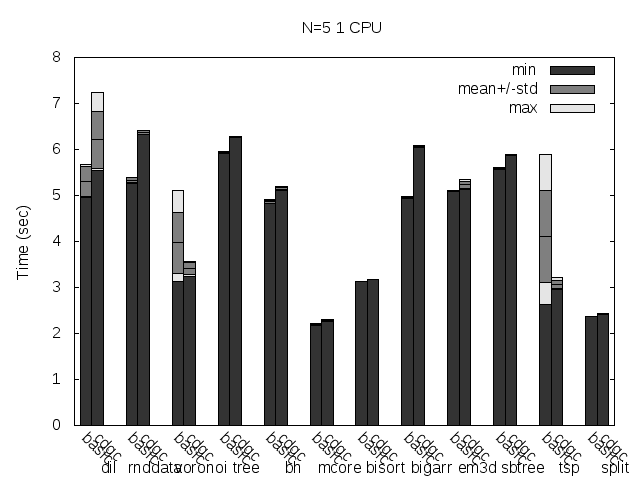
Precise scanning patch doing conservative scanning (not storing the type information at all). Stripped.

Precise scanning storing the type information at the end of the GC blocks. Stripped.

Precise scanning storing the type information outside the GC blocks. Stripped.
Here are the same tests as above, but disabling Linux heap addresses randomization (setarch -R):
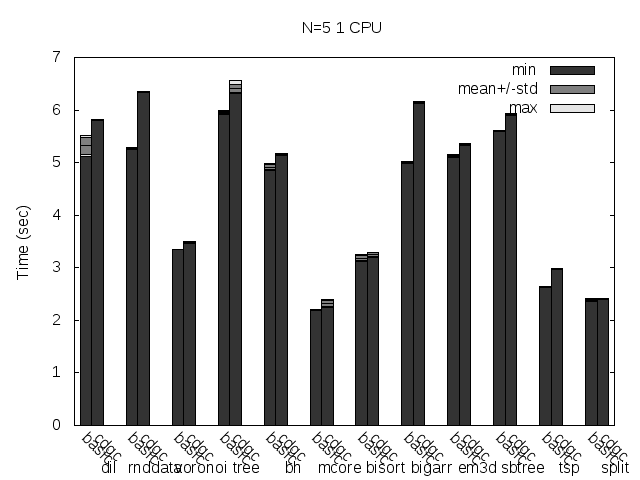
Precise scanning patch doing conservative scanning (not storing the type information at all). Stripped. No addresses randomization.

Precise scanning storing the type information at the end of the GC blocks. Stripped. No addresses randomization.
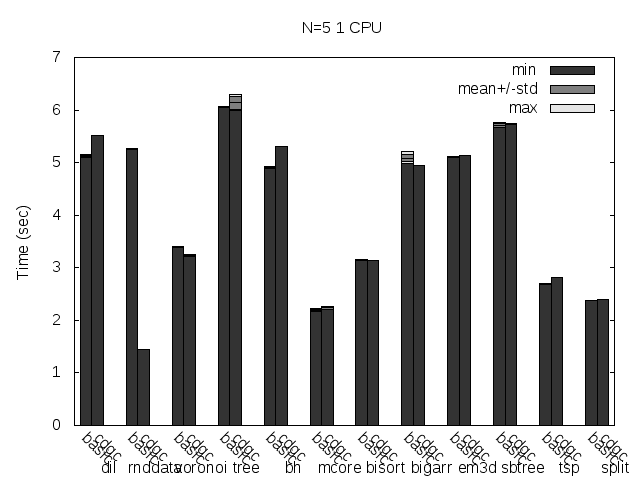
Precise scanning storing the type information outside the GC blocks. Stripped. No addresses randomization.
Update
I noticed that the plots doesn't always reflect 100% what's stated in the text, that is because the text was written with another run results and it seems like the tested programs are very sensitive to the heap and binary addresses the kernel assign to the program.
Anyway, what you can see in the plots very clear is how stripping the binaries changes the results a lot and how the performance is particularly improved when storing the type information pointer outside the GC'ed memory when the binaries are not stripped.
Presenting CDGC
by Leandro Lucarella on 2010- 07- 28 21:48 (updated on 2010- 07- 28 21:48)- with 0 comment(s)
I've just published the git repository of my D GC implementation: CDGC. The name stands for Concurrent D Garbage Collector but right now you may call it Configurable D Garbage Collector, as there is no concurrency at all yet, but the GC is configurable via environment variables :)
It's based on the Tango (0.99.9) basic GC, there are only few changes at the moment, probably the bigger ones are:
- Runtime configurability using environment variables.
- Logging of malloc()s and collections to easily get stats about time and space consumed by the GC (option malloc_stats_file [str] and collect_stats_file [str]).
- Precise heap scanning based on the patches published in bug 3463 (option conservative [bool]).
- Runtime configurable debug features (option mem_stomp [bool] and sentinel [bool]).
- Other non user-visible cleanups.
The configuration is done via the D_GC_OPTS environment variable, and the format is:
D_GC_OPTS=opt1=value:opt2=value:bool_opt:opt3=value
Where opt1, opt2, opt3 and bool_opt are option names and value is their respective values. Boolean options can omit the value (which means true) or use a value of 0 or 1 to express false and true respectively. String options have no limitations, except they can't have the : char in their values and they have a maximum value length (255 at this moment).
At the moment is a little slower than the Tango basic GC, because the precise scanning is done very naively and a lot of calls to findPool() are done. This will change in the future.
There is a lot of work to be done (cleanup, optimization and the concurrent part :), but I'm making it public because maybe someone could want to adapt some of the ideas or follow the development.
Performance WTF
by Leandro Lucarella on 2010- 07- 14 03:47 (updated on 2010- 07- 25 03:11)- with 0 comment(s)
How do I start describing this problem? Let's try to do it in chronological order...
Introduction
I've collected a bunch of little programs to use as a benchmark suite for the garbage collector for my thesis. I was running only a few manually each time I've made a change to the GC to see how things were going (I didn't want to make changes that degrade the performance). A little tired of this (and missing the point of having several tests using just a few), I've decided to build a Makefile to compile the programs, run the tests and generate some graphs with the timings to compare the performance against the current D GC (Tango really).
The Problem
When done, I noticed a particular test that was notably slower in my implementation (it went from ~3 seconds to ~5 seconds). Here is the result (see the voronoi test, if you can read the labels, there is some overlapping because my effort to improve the graph was truncated by this issue :).

But I didn't recall it being that way when running the test manually. So I ran the test manually again, and it took ~3 seconds, not ~5. So I started to dig where the difference came from. You'll be surprised by my findings, the difference came from executing the tests inside the Makefile!
Yes, take a look at this (please note that I've removed all output from the voronoi program, the only change I've made):
$ /usr/bin/time -f%e ./voronoi -n 30000
3.10
$ echo 'all:' > Makefile
$ echo -e '\t$C' >> Makefile
$ make C="/usr/bin/time -f%e ./voronoi -n 30000"
/usr/bin/time -f%e ./voronoi -n 30000
5.11
$
This is not just one isolated run, I've tried hundreds of runs and the results are reproducible and stable.
Further Investigation
I don't remember exactly how I started, but early enough, noticing that the Tango's basic GC didn't suffered from that problem, and being my GC based on that one, I bisected my repository to see what was introducing such behaviour. The offending patch was removing the difference between committed and uncommitted pages in pools. I can see that this patch could do more harm than good now (I didn't tried the benchmark when I did that change I think), because more pages are looped when working with pools, but I can't see how this would affect only the program when it's executed by Make!!!
I had a patch that made thing really nasty but not a clue why they were nasty. I've tried everything. First, the obvious: use nice and ionice (just in case) to see if I was just being unlucky with the system load (very unlikely since I did hundreds of runs in different moments, but still). No change.
I've tried running it on another box. Mine is a Quad-Core, so I've tried the Dual-Core from work and I had the same problem, only the timing difference were a little smaller (about ~4.4 seconds), so I thought it might be something to do to with the multi-cores, so I've tried it in a single core, but the problem was the same (~10.5 seconds inside make, ~7 outside). I've tried with taskset in the multi-core boxes too. I've tried putting all the CPUs with the performance governor using cpufreq-set too, but didn't help.
Since I'm using DMD, which works only in 32 bits for now, and since my box, and the box at work are both 64 bits, I suspected from that too, but the old AMD is 32 bits and I see the problem there too.
I've tried valgrind + callgrind + kcachegrind but it seems like valgrind emulation is not affected by whatever difference is when the program is ran inside make because the results for the run inside and outside make were almost identical.
I've tried env -i, just in case some weird environment variable was making the difference, but nothing.
I've tried strace too, to see if I spotted anything weird, and I saw a couple of weird things (like the addresses returned by mmap being suspiciously very different), but nothing too concrete (but I think inspecting the strace results more thoughtfully might be one of the most fertile paths to follow). I took a look at the timings of the syscalls and there was nothing taking too much time, most of the time is spent in the programs calculations.
So I'm really lost here. I still have no idea where the difference could come from, and I guess I'll have to run the tests from a separate shell script instead of directly inside make because of this. I'll ask to the make developers about this, my only guess is that maybe make is doing some trickery with the scheduler of something like that for the -j option. And I'll take a look to the offending patch too, to see if the performance was really degraded and maybe I'll revert it if it does, no matter what happen with this issue.
If you have any ideas on what could be going on, anything, please let me know (in a comment of via e-mail). Thanks :)
Update
I've posted this to the Make mailing list, but unfortunately didn't got any useful answer. Thanks anyway to all the people that replied with nice suggestions!
Update
Thanks Alb for the investigation, that was a 1/4kg of ice-cream well earned =P
A couple of notes about his findings. An easy way to trigger this behaviour is using the command setarch, the option -L changes the memory layout to ADDR_COMPAT_LAYOUT, see the commit that introduced the new layout for more details.
The call to setrlimit(RLIMIT_STACK, RLIM_INFINITY) by Make (which has a reason) triggers that behaviour too because the new layout can't have an unlimited stack, so using ulimit (ulimit -s unlimited) causes the same behaviour.
The same way, if you type ulimit -s 8192 ./voronoi as a command in a Makefile, the effect is reverted and the command behaves as outside the Makefile.
Part of the mystery is solved, but a question remains: why the test is so address-space-layout dependant? It smells like a GC bug (present in the basic GC too, as other tests I've done show the same odd behaviour, less visibly, but still, probably because of the removal of the distinction between committed and uncommitted memory patch).
Update
Last update, I promise! =)
I think I know what is adding the extra variance when the memory layout is randomized: false pointers.
Since the GC is conservative, data is usually misinterpreted as pointers. It seems that are address spaces that makes much more likely that simple data is misinterpreted as a valid pointer, at least for the voronoi test. This is consistent with other tests. Tests with random data notably increases their variance among runs and are pretty stable when the memory layout is not randomized.
I'll try to give the patch to integrate precise heap scanning a try, and see if it improves things.
What remains a mystery is what happened with the committed memory distinction, now I can't reproduce the results. I made so many measures and changes, that maybe I just got lost in a bad measure (for example, with the CPU using the ondemand governor). I've tried again the tests with and without that change and the results are pretty the same (a little better for the case with the distinction, but a really tiny difference indeed).
Well, that's all for now, I'll give this post a rest =)
Update
Don't believe me, ever! =P
I just wanted to say that's is confirmed, the high variance in the timings when heap randomization is used is because of false pointers. See this comment for more details.
Delegates and inlining
by Leandro Lucarella on 2010- 06- 28 15:30 (updated on 2010- 06- 28 15:30)- with 0 comment(s)
Sometimes performance issues matter more than you might think for a language. In this case I'm talking about the D programming language.
I'm trying to improve the GC, and I want to improve it not only in terms of performance, but in terms of code quality too. But I'm hitting some performance issues that prevent me to make the code better.
D support high level constructs, like delegates (aka closures). For example, to do a simple linear search I wanted to use this code:
T* find_if(bool delegate(ref T) predicate)
{
   for (size_t i = 0; i < this._size; i++)
      if (predicate(this._data[i]))
         return this._data + i;
   return null;
}
...
auto p = find_if((ref T t) { return t > 5; });
But in DMD, you don't get that predicate inlined (neither the find_if() call, for that matter), so you're basically screwed, suddenly you code is ~4x slower. Seriously, I'm not joking, using callgrind to profile the program (DMD's profiler doesn't work for me, I get a stack overflow for a recursive call when I try to use it), doing the call takes 4x more instructions, and in a real life example, using Dil to generate the Tango documentation, I get a 3.3x performance penalty for using this high-level construct.
I guess this is why D2's sort uses string mixins instead of delegates for this kind of things. The only lectures that I can find from this is delegates are failing in D, either because they have a bad syntax (compare sort(x, (ref X a, ref X b) { return a > b; }) with sort!"a < b"(x)) or because their performance sucks (mixins are inlined by definition, think of C macros). The language designer is telling you "don't use that feature".
Fortunately the later is only a DMD issue, LDC is able to inline those predicates (they have to inhibit the DMD front-end inlining to let LLVM do the dirty work, and it definitely does it better).
The problem is I can't use LDC because for some unknown reason it produces a non-working Dil executable, and Dil is the only real-life program I have to test and benchmark the GC.
I think this issue really hurts D, because if you can't write performance critical code using higher-level D constructs, you can't showcase your own language in the important parts.
Stats for the basic GC
by Leandro Lucarella on 2009- 10- 08 23:08 (updated on 2009- 10- 08 23:08)- with 0 comment(s)
Here are some graphs made from my D GC benchmarks using the Tango (0.99.8) basic collector, similar to the naive ones but using histograms for allocations (time and space):


Some comments:
- The Wasted space is the Uncommitted space (since the basic GC doesn't track the real size of the stored object).
- The Stop-the-world time is the time all the threads are stopped, which is almost the same as the time spent scanning the heap.
- The Collect time is the total time spent in a collection. The difference with the Stop-the-world time is almost the same as the time spent in the sweep phase, which is done after the threads have being resumed (except the thread that triggered the collection).
There are a few observations to do about the results:
- The stop the world time varies a lot. There are tests where is almost unnoticeable (tree), tests where it's almost equals to the total collection time (rnd_data, rnd_data_2, split) and test where it's in the middle (big_arrays). I can't see a pattern though (like heap occupancy).
- There are tests where it seems that collections are triggered for no reason; there is plenty of free space when it's triggered (tree and big_arrays). I haven't investigated this yet, so if you can see a reason, please let me know.
DGC page is back
by Leandro Lucarella on 2009- 10- 02 16:17 (updated on 2009- 10- 02 16:17)- with 0 comment(s)
Life in hell
by Leandro Lucarella on 2009- 09- 06 21:24 (updated on 2009- 09- 06 21:24)- with 0 comment(s)
Warning
Long post ahead =)
As I said before, debug is hell in D, at least if you're using a compiler that doesn't write proper debug information and you're writing a garbage collector. But you have to do it when things go wrong. And things usually go wrong.
This is a small chronicle about how I managed to debug a weird problem =)
I had my Naive GC working and getting good stats with some small micro-benchmarks, so I said let's benchmark something real. There is almost no real D applications out there, suitable for an automated GC benchmark at least [1]. Dil looked like a good candidate so I said let's use Dil in the benchmark suite!.
And I did. But Dil didn't work as I expected. Even when running it without arguments, in which case a nice help message like this should be displayed:
dil v1.000
Copyright (c) 2007-2008 by Aziz Köksal. Licensed under the GPL3.

Subcommands:
  help (?)
  compile (c)
  ddoc (d)
  highlight (hl)
  importgraph (igraph)
  python (py)
  settings (set)
  statistics (stats)
  tokenize (tok)
  translate (trans)

Type 'dil help <subcommand>' for more help on a particular subcommand.

Compiled with Digital Mars D v1.041 on Sat Aug 29 18:04:34 2009.
I got this instead:
Generate an XML or HTML document from a D source file.
Usage:
  dil gen file.d [Options]

Options:
  --syntax         : generate tags for the syntax tree
  --xml            : use XML format (default)
  --html           : use HTML format

Example:
  dil gen Parser.d --html --syntax > Parser.html
Which it isn't even a valid Dil command (it looks like a dead string in some data/lang_??.d files).
I ran Valgrind on it and detected a suspicious invalid read of size 4 when reading the last byte of a 13 bytes long class instance. I thought maybe the compiler was assuming the GC allocated block with size multiples of the word size, so I made gc_malloc() allocate multiples of the word size, but nothing happened. Then I thought that maybe the memory blocks should be aligned to a multiple of a word, so I made gc_malloc() align the data portion of the cell to a multiple of a word, but nothing.
Since Valgrind only detected that problem, which was at the static constructor of the module tango.io.Console, I though it might be a Tango bug, so I reported it. But it wasn't Tango's fault. The invalid read looked like a DMD 1.042 bug; DMD 1.041 didn't have that problem, but my collector still failed to run Dil. So I was back to zero.
I tried the Tango stub collector and it worked, so I tried mine disabling the collections, and it worked too. So finally I could narrow the problem to the collection phase (which isn't much, but it's something). The first thing I could think it could be wrong in a collection is that cells still in use are swept as if they were unused, so I then disabled the sweep phase only, and it kept working.
So, everything pointer to prematurely freed cells. But why my collector was freeing cells prematurely being so, so simple? I reviewed the code a couple of times and couldn't find anything evidently wrong. To confirm my theory and with the hope of getting some extra info, I decided to write a weird pattern in the swept cells and then check if that pattern was intact when giving them back to the mutator (the basic GC can do that too if compiled with -debug=MEMSTOMP). That would confirm that the swept memory were still in use. And it did.
The I tried this modified GC with memory stomp with my micro-benchmarks and they worked just fine, so I started to doubt again that it was my GC's problem. But since those benchmarks didn't use much of the GC API, I thought maybe Dil was using some strange features of making some assumptions that were only true for the current implementation, so I asked Aziz Köksal (Dil creator) and he pointed me to some portion of code that allocated memory from the C heap, overriding the operators new and delete for the Token struct. There is a bug in Dil there, because apparently that struct store pointers to the GC heap but it's not registered as a root, so it looks like a good candidate.
So I commented out the overridden new and delete operators, so the regular GC-based operators were used. But I still got nothing, the wrong help message were printed again. Then I saw that Dil was manually freeing memory using delete. So I decided to make my gc_free() implementation a NOP to let the GC take over of all memory management... And finally all [2] worked out fine! =)
So, the problem should be either my gc_free() implementation (which is really simple) or a Dil bug.
In order to get some extra information on where the problem is, I changed the Cell.alloc() implementation to use mmap to allocate whole pages, one for the cell's header, and one or more for the cell data. This way, could easily mprotect the cell data when the cell was swept (and un-mprotecting them when they were give back to the program) in order to make Dil segfault exactly where the freed memory was used.
I ran Dil using strace and this is what happened:
[...]
 (a)  write(1, "Cell.alloc(80)\n", 15)        = 15
 (b)  mmap2(NULL, 8192, PROT_READ|PROT_WRITE, ...) = 0xb7a2e000
[...]
 (c)  mprotect(0xb7911000, 4096, PROT_NONE)   = 0
      mprotect(0xb7913000, 4096, PROT_NONE)   = 0
[...]
      mprotect(0xb7a2b000, 4096, PROT_NONE)   = 0
      mprotect(0xb7a2d000, 4096, PROT_NONE)   = 0
 (d)  mprotect(0xb7a2f000, 4096, PROT_NONE)   = 0
      mprotect(0xb7a43000, 4096, PROT_NONE)   = 0
      mprotect(0xb7a3d000, 4096, PROT_NONE)   = 0
[...]
      mprotect(0xb7a6b000, 4096, PROT_NONE)   = 0
 (e)  mprotect(0xb7a73000, 4096, PROT_NONE)   = 0
 (f)  mprotect(0xb7a73000, 4096, PROT_READ|PROT_WRITE) = 0
      mprotect(0xb7a6b000, 4096, PROT_READ|PROT_WRITE) = 0
[...]
      mprotect(0xb7a3f000, 4096, PROT_READ|PROT_WRITE) = 0
 (g)  mprotect(0xb7a3d000, 4096, PROT_READ|PROT_WRITE) = 0
      --- SIGSEGV (Segmentation fault) @ 0 (0) ---
      +++ killed by SIGSEGV (core dumped) +++
(a) is a debug print, showing the size of the gc_malloc() call that got the address 0xb7a2e000. The mmap (b) is 8192 bytes in size because I allocate a page for the cell header (for internal GC information) and another separated page for the data (so I can only mprotect the data page and keep the header page read/write); that allocation asked for a new fresh couple of pages to the OS (that's why you see a mmap).
From (c) to (e) you can see a sequence of several mprotect, that are cells being swept by a collection (protecting the cells against read/write so if the mutator tries to touch them, a SIGSEGV is on the way).
From (f) to (g) you can see another sequence of mprotect, this time giving the mutator permission to touch that pages, so that's gc_malloc() recycling the recently swept cells.
(d) shows the cell allocated in (a) being swept. Why the address is not the same (this time is 0xb7a2f000 instead of 0xb7a2e000)? Because, as you remember, the first page is used for the cell header, so the data should be at 0xb7a2e000 + 4096, which is exactly 0xb7a2f000, the start of the memory block that the sweep phase (and gc_free() for that matter) was protecting.
Finally we see the program getting his nice SIGSEGV and dumping a nice little core for touching what it shouldn't.
Then I opened the core with GDB and did something like this [3]:
Program terminated with signal 11, Segmentation fault.
(a)  #0  0x08079a96 in getDispatchFunction ()
     (gdb) print $pc
(b)  $1 = (void (*)()) 0x8079a96 <getDispatchFunction+30>
     (gdb) disassemble $pc
     Dump of assembler code for function
     getDispatchFunction:
     0x08079a78 <getDispatchFunction+0>:  push   %ebp
     0x08079a79 <getDispatchFunction+1>:  mov    %esp,%ebp
     0x08079a7b <getDispatchFunction+3>:  sub    $0x8,%esp
     0x08079a7e <getDispatchFunction+6>:  push   %ebx
     0x08079a7f <getDispatchFunction+7>:  push   %esi
     0x08079a80 <getDispatchFunction+8>:  mov    %eax,-0x4(%ebp)
     0x08079a83 <getDispatchFunction+11>: mov    -0x4(%ebp),%eax
     0x08079a86 <getDispatchFunction+14>: call   0x80bccb4 <objectInvariant>
     0x08079a8b <getDispatchFunction+19>: push   $0xb9
     0x08079a90 <getDispatchFunction+24>: mov    0x8(%ebp),%edx
     0x08079a93 <getDispatchFunction+27>: add    $0xa,%edx
(c)  0x08079a96 <getDispatchFunction+30>: movzwl (%edx),%ecx
     [...]
     (gdb) print /x $edx
(d)  $2 = 0xb7a2f000
First, in (a), GDB tells where the program received the SIGSEGV. In (b) I print the program counter register to get a more readable hint on where the program segfaulted. It was at getDispatchFunction+30, so I disassemble that function to see that the SIGSEGV was received when doing movzwl (%edx),%ecx (moving the contents of the ECX register to the memory pointed to by the address in the register EDX) at (c). In (d) I get the value of the EDX register, and it's 0xb7a2f000. Do you remember that value? Is the data address for the cell at 0xb7a2e000, the one that was recently swept (and mprotected). That's not good for business.
This is the offending method (at dil/src/ast/Visitor.d):
Node function(Visitor, Node) getDispatchFunction()(Node n)
{
    return cast(Node function(Visitor, Node))dispatch_vtable[n.kind];
}
Since I can't get any useful information from GDB (I can't even get a proper backtrace [4]) except for the mangled function name (because the wrong debug information produced by DMD), I had to split that function into smaller functions to confirm that the problem was in n.kind (I guess I could figure that out by eating some more assembly, but I'm not that well trained at eating asm yet =). This means that the Node instance n is the one prematurely freed.
This is particularly weird, because it looks like the node is being swept, not prematurely freed using an explicit delete. So it seems like the GC is missing some roots (or there are non-aligned pointers or weird stuff like that). The fact that this works fine with the Tango basic collector is intriguing too. One thing I can come up with to explain why it works in the basic collector is because it makes a lot less collections than the naive GC (the latter is really lame =). So maybe the rootless object becomes really free before the basic collector has a chance to run a collection and because of that the problem is never detected.
I spent over 10 days now investigating this issue (of course this is not near a full-time job for me so I can only dedicate a couple of days a week to this =), and I still can't find a clear cause for this problem, but I'm a little inclined towards a Dil bug, so I reported one =). So we'll see how this evolves; for now I'll just make gc_free() a NOP to continue my testing...
| [1] | Please let me know if you have any working, real, Tango-based D application suitable for GC benchmarks (i.e., using the GC and easily scriptable to run it automatically). |
| [2] | all being running Dil without arguments to get the right help message =) |
| [3] | I have shortened the name of the functions because they were huge, cryptic, mangled names =). The real name of getDispatchFunction is _D3dil3ast7Visitor7Visitor25__T19getDispatchFunctionZ19getDispatchFunctionMFC3dil3ast4Node4NodeZPFC3dil3ast7Visitor7VisitorC3dil3ast4Node4NodeZC3dil3ast4Node4Node (is not much better when demangled: class dil.ast.Node.Node function(class dil.ast.Visitor.Visitor, class dil.ast.Node.Node)* dil.ast.Visitor.Visitor.getDispatchFunction!().getDispatchFunction(class dil.ast.Node.Node) =). The real name of objectInvariant is D9invariant12_d_invariantFC6ObjectZv and has no demagled name that I know of, but I guessed is the Object class invariant. |
| [4] | Here is what I get from GDB: (gdb) bt #0 0x08079a96 in getDispatchFunction () #1 0xb78d5000 in ?? () #2 0xb789d000 in ?? () Backtrace stopped: previous frame inner to this frame (corrupt stack?) (function name unmangled and shortened for readbility) |
Allocations graphs
by Leandro Lucarella on 2009- 08- 27 00:54 (updated on 2009- 08- 27 00:54)- with 0 comment(s)
Here are a set of improved statistics graphs, now including allocation statistics. All the data is plotted together and using the same timeline to ease the analysis and comparison.
Again, all graphs (as the graph title says), are taken using the Naive GC (stats code still not public yet :) and you can find the code for it in my D GC benchmark repository.
This time the (big) graphs are in EPS format because I could render them in PNG as big as I wanted and I didn't had the time to fix that =S


The graphs shows the same as in the previous post with the addition of allocation time (how long it took to perform the allocation) and space (how many memory has been requested), which are rendered in the same graph, and an histogram of cell sizes. The histogram differentiates cells with and without the NO_SCAN bit, which might be useful in terms on seeing how bad the effect of false positives could be.
You can easily see how allocation time peeks match allocations that triggered a collection for example, and how bad can it be the effect of false positives, even when almost all the heap (99.99%) has the NO_SCAN bit (see rnd_data_2).
Graphs
by Leandro Lucarella on 2009- 08- 18 03:26 (updated on 2009- 08- 18 03:26)- with 0 comment(s)
It's been exactly 3 months since the last post. I spent the last months writing my thesis document (in Spanish), working, and being unproductive because of the lack of inspiration =)
But in the last couple of days I decided to go back to the code, and finish the statistics gathering in the Naive GC (the new code is not published yet because it needs some polishing). Here are some nice graphs from my little D GC benchmark:


The graphs shows the space and time costs for each collection in the programs life. The collection time is divided in the time spent in the malloc() that triggered the collection, the time spent in the collection itself, and the time the world has to be stopped (meaning the time all the threads were paused because of the collection). The space is measured before and after the collection, and the total memory consumed by the program is divided in 4 areas: used space, free space, wasted space (space that the user can't use but it's not used by the collector either) and overhead (space used by the collector itself).
As you can see, the naive collector pretty much sucks, specially for periods of lots of allocation (since it just allocated what it's asked in the gc_malloc() call if the collection failed).
The next step is to modify the Tango's Basic collector to gather the same data and see how things are going with it.
Naive GC fixes
by Leandro Lucarella on 2009- 05- 17 22:09 (updated on 2009- 05- 17 22:09)- with 0 comment(s)
I haven't been posting very often lately because I decided to spend some time writing my thesis document (in Spanish), which was way behind my current status, encouraged by my code-wise bad weekend =P.
Alberto Bertogli was kind enough to review my Naive GC implementation and sent me some patches, improving the documentation (amending my tarzanesque English =) and fixing a couple of (nasty) bugs [1] [2].
I'm starting to go back to the code, being that LDC is very close to a new release and things are starting to settle a little, so I hope I can finish the statistics gathering soon.
Debug is hell
by Leandro Lucarella on 2009- 05- 04 03:24 (updated on 2009- 05- 04 03:24)- with 0 comment(s)
Warning
Rant ahead.
If Matt Groeing would ever written a garbage collector I'm sure he would made a book in the Life in Hell series called Debug is Hell.
You can't rely on anything: unit tests are useless, they depend on your code to run and you can't get a decent backtrace ever using a debugger (the runtime calls seems to hidden to the debugger). I don't know if the last one is a compiler issue (I'm using DMD right now because my LDC copy broken =( ).
Add that to the fact that GNU Gold doesn't work, DMD doesn't work, Tango doesn't work [*] and LDC doesn't work, and that it's already hard to debug in D because most of the mainstream tools (gdb, binutils, valgrind) don't support the language (can't demangle D symbols for instance) and you end up with a very hostile environment to work with.
Anyway, it was a very unproductive weekend, my statistics gathering code seems to have some nasty bug and I'm not being able to find it.
PS: I want to apologize in advance to the developers of GNU Gold, DMD, Tango and LDC because they make great software, much less crappier than mine (well, to be honest I'm not so sure about DMD ;-P), it's just a bad weekend. Thank you for your hard work, guys =)
| [*] | Tango trunk is supposed to be broken for Linux |
Statistics, benchmark suite and future plans
by Leandro Lucarella on 2009- 05- 02 01:43 (updated on 2009- 05- 02 01:43)- with 4 comment(s)
I'm starting to build a benchmark suite for D. My benchmarks and programs request was a total failure (only Leonardo Maffi offered me a small trivial GC benchmark) so I have to find my own way.
This is a relative hard task, I went through dsource searching for real D programs (written using Tango, I finally desisted in making Phobos work in LDC because it would be a very time consuming task) and had no much luck either. Most of the stuff there are libraries, the few programs are: not suitable for an automated benchmark suite (like games), abandoned or work with Phobos.
I found only 2 candidates:
I just tried dack for now (I tried MiniD a while ago but had some compilation errors, I have to try again). Web-GMUI seems like a nice maintained candidate too, but being a client to monitor other BitTorrent clients, seems a little hard to use in automated benchmarks.
For a better usage of the benchmark suite, I'm adding some statistics gathering to my Naive GC implementation, and I will add that too to the Tango basic GC implementation. I will collect this data for each and every collection:
- Collection time
- Stop-the-world time (time all the threads were suspended)
- Current thread suspension time (this is the same as Collection time in both Naive and Tango Basic GC implementations, but it won't be that way in my final implementation)
- Heap memory used by the program
- Free heap memory
- Memory overhead (memory used by the GC not usable by the program)
The three last values will be gathered after and before the collection is made.
Anyway, if you know any program that can be suitable for use in an automated benchmark suite that uses Tango, please, please let me know.
Naive Garbage Collector
by Leandro Lucarella on 2009- 04- 27 01:49 (updated on 2009- 04- 27 01:49)- with 0 comment(s)
I was working in a naive garbage collector implementation for D, as a way to document the process of writing a GC for D.
From the Naive Garbage Collector documentation:
The idea behind this implementation is to document all the bookkeeping and considerations that has to be taken in order to implement a garbage collector for D.
The garbage collector algorithm itself is extremely simple so focus can be held in the specifics of D, and not the algorithm. A completely naive mark and sweep algorithm is used, with a recursive mark phase. The code is extremely inefficient in order to keep the code clean and easy to read and understand.
Performance is, as expected, horrible, horrible, horrible (2 orders of magnitude slower than the basic GC for the simple Tango GC Benchmark) but I think it's pretty good as documentation =)
I have submitted the implementation to Tango in the hope that it gets accepted. A git repository is up too.
If you want to try it out with LDC, you have to put the files into the naive directory in tango/lib/gc and edit the file runtime/CMakeLists.txt and search/replace "basic" for "naive". Then you have to search for the line:
file(GLOB GC_D ${RUNTIME_GC_DIR}/*.d)
And replace it with:
file(GLOB GC_D ${RUNTIME_GC_DIR}/gc/*.d)
Comments and reviews are welcome, and please let me know if you try it =)
Immix mark-region garbage collector
by Leandro Lucarella on 2009- 04- 25 20:39 (updated on 2009- 04- 25 20:39)- with 0 comment(s)
Yesterday Fawzi Mohamed pointed me to a Tango forums post (<rant>god! I hate forums</rant> =) where Keith Nazworth announces he wants to start a new GC implementation in his spare time.
He wants to progressively implement the Immix Garbage Collector.
I read the paper and it looks interesting, and it looks like it could use the parallelization I plan to add to the current GC, so maybe our efforts can be coordinated to leave the possibility to integrate both improvements together in the future.
A few words about the paper: the heap organization is pretty similar to the one in the current GC implementation, except Immix proposes that pages should not be divided in fixed-size bins, but do pointer bump variable sized allocations inside a block. Besides that, all other optimizations that I saw in the paper are somehow general and can be applied to the current GC at some point (but some of them maybe don't fit as well). Among these optimizations are: opportunistic moving to avoid fragmentation, parallel marking, thread-local pools/allocator and generations. Almost all of the optimizations can be implemented incrementally, starting with a very basic collector which is not very far from the actual one.
There were some discussion on adding the necessary hooks to the language to allow a reference counting based garbage collector in the newsgroup (don't be fooled by the subject! Is not about disabling the GC =) and weak references implementation. There's a lot of discussion about GC lately in D, which is really exciting!
Guaranteed finalization support
by Leandro Lucarella on 2009- 04- 19 17:03 (updated on 2009- 04- 19 17:03)- with 0 comment(s)
There was some discussion going on about what I found in my previous post. Unfortunately the discussion diverged a lot, and lots of people seems to defend not guaranteed finalization for no reason, or arguing that finalization is supposed to be used with RAII.
I find all the arguments very weak, at least for convincing me that the current specs are not broken (if finalizers shouldn't be used with objects with its lifetime determined by the GC, then don't let that happen).
The current specs allow a D implementation with a GC that don't call finalizers for collected objects at all! So any D program relying on that is actually broken.
Anyways, from all the possible solutions to this problem, I think the better is just to provide guaranteed finalization, at least at program exit. That is doable (and easily doable by the way).
I filed a bug report about this, but unfortunately, seeing how the discussion at the news group went, I'm very skeptic about this being fixed at all.
Object finalization
by Leandro Lucarella on 2009- 04- 18 15:18 (updated on 2009- 04- 18 15:18)- with 0 comment(s)
I'm writing a trivial naive (but fully working) GC implementation. The idea is:
- Improve my understanding about how a GC is written from the ground up
- Ease the learning curve for other people wanting to learn how to write a D GC
- Serve as documentation (will be fully documented)
- Serve as a benchmarking base (to see how better is an implementation compared to the dumbest and simplest implementation ever =)
There is a lot of literature on GC algorithms, but there is almost no literature of the particularities on implementing a GC in D (how to handle the stack, how finalize an object, etc.). The idea of this GC implementation is to tackle this. The collection and allocation algorithms are really simple so you can pay attention to the other stuff.
The exercise is already paying off. Implementing this GC I was able to see some details I missed when I've done the analysis of the current implementation.
For example, I completely missed finalization. The GC stores for each cell a flag that indicates when an object should be finalized, and when the memory is swept it calls rt_finalize() to take care of the business. That was easy to add to my toy GC implementation.
Then I was trying to decide if all memory should be released when the GC is terminated or if I could let the OS do that. Then I remembered finalization, so I realized I should at least call the finalizers for the live objects. So I went see how the current implementation does that.
It turns out it just calls a full collection (you have an option to not collect at all, or to collect excluding roots from the stack, using the undocumented gc_setTermCleanupLevel() and gc_gsetTermCleanupLevel() functions). So if there are still pointers in the static data or in the stack to objects with finalizers, those finalizers are never called.
I've searched the specs and it's a documented feature that D doesn't guarantee that all objects finalizers get called:
The garbage collector is not guaranteed to run the destructor for all unreferenced objects. Furthermore, the order in which the garbage collector calls destructors for unreference objects is not specified. This means that when the garbage collector calls a destructor for an object of a class that has members that are references to garbage collected objects, those references may no longer be valid. This means that destructors cannot reference sub objects.
I knew that ordering was not guaranteed so you can't call other finalizer in a finalizer (and that make a lot of sense), but I didn't knew about the other stuff. This is great for GC implementors but not so nice for GC users ;)
I know that the GC, being conservative, has a lot of limitations, but I think this one is not completely necessary. When the program ends, it should be fairly safe to call all the finalizers for the live objects, referenced or not.
In this scheme, finalization is as reliable as UDP =)
Understanding the current GC, conclusion
by Leandro Lucarella on 2009- 04- 11 19:36 (updated on 2009- 04- 11 19:36)- with 0 comment(s)
Now that I know fairly deeply the implementation details about the current GC, I can compare it to the techniques exposed in the GC Book.
Tri-colour abstraction
Since most literature speaks in terms of the tri-colour abstraction, now it's a good time to translate how this is mapped to the D GC implementation.
As we all remember, each cell (bin) in D has several bits associated to them. Only 3 are interesting in this case:
- mark
- scan
- free (freebits)
So, how we can translate this bits into the tri-colour abstraction?
- Black
Cells that were marked and scanned (there are no pointer to follow) are coloured black. In D this cells has the bits:
mark = 1
scan = 0
free = 0
- Grey
Cells that has been marked, but they have pointers to follow in them are coloured grey. In D this cells has the bits:
mark = 1
scan = 1
free = 0
- White
Cells that has not been visited at all are coloured white (all cells should be colored white before the marking starts). In D this cells has the bits:
mark = 0
scan = X
Or:
free = 1
The scan bit is not important in this case (but in D it should be 0 because scan bits are cleared before the mark phase starts). The free bit is used for the cells in the free list. They are marked before other cells get marked with bits mark=1 and free=1. This way the cells in the free list don't get scanned (mark=1, scan=0) and are not confused with black cells (free=1), so they can be kept in the free list after the mark phase is done. I think this is only necessary because the free list is regenerated.
Improvements
Here is a summary of improvements proposed by the GC Book, how the current GC is implemented in regards to this improvements and what optimization opportunities can be considered.
Mark stack
The simplest version of the marking algorithm is recursive:
mark(cell)
    if not cell.marked
        cell.marked = true
        for child in cell.children
            mark(child)
The problem here is, of course, stack overflow for very deep heap graphs (and the space cost).
The book proposes using a marking stack instead, and several ways to handle stack overflow, but all these are only useful for relieving the symptom, they are not a cure.
As a real cure, pointer reversal is proposed. The idea is to use the very same pointers to store the mark stack. This is constant in space, and needs only one pass through the help, so it's a very tempting approach. The bad side is increased complexity and probably worse cache behavior (writes to the heap dirties the entire heap, and this can kill the cache).
Current implementation
The D GC implementation does none of this. Instead it completes the mark phase by traversing the heap (well, not really the heap, only the bit sets) in several passes, until no more data to scan can be found (all cells are painted black or white). While the original algorithm only needs one pass through the heap, this one need several. This trades space (and the complexity of stack overflow handling) for time.
Optimization opportunities
This seems like a fair trade-off, but alternatives can be explored.
Bitmap marking
The simplest mark-sweep algorithm suggests to store marking bits in the very own cells. This can be very bad for the cache because a full traversal should be done across the entire heap. As an optimization, a bitmap can be used, because they are much small and much more likely to fit in the cache, marking can be greatly improved using them.
Current implementation
Current implementation uses bitmaps for mark, scan, free and other bits. The bitmap implementation is GCBits and is a general approach.
The bitmap stores a bit for each 16 bytes chunks, no matter what cell size (Bins, or bin size) is used. This means that 4096/16 = 256 bits (32 bytes) are used for each bitmap for every page in the GC heap. Being 5 bitmaps (mark, scan, freebits, finals and noscan), the total spaces per page is 160 bytes. This is a 4% space overhead in bits only.
This wastes some space for larger cells.
Optimization opportunities
The space overhead of bitmaps seems to be fairly small, but each byte counts for the mark phase because of the cache. A heap with 64 MiB uses 2.5 MiB in bitmaps. Modern processors come with about that much cache, and a program using 64 MiB doesn't seems very rare. So we are pushing the limits here if we want our bitmaps to fit in the cache to speed up the marking phase.
I think there is a little room for improvement here. A big object, lets say it's 8 MiB long, uses 640 KiB of memory for bitmaps it doesn't need. I think some specialized bitmaps can be used for large object, for instance, to minimize the bitmaps space overhead.
There are some overlapping bits too. mark=0 and scan=1 can never happen for instance. I think it should be possible to use that combination for freebits, and get rid of an entire bitmap.
Lazy sweep
The sweep phase is done generally right after the mark phase. Since normally the collection is triggered by an allocation, this can be a little disrupting for the thread that made that allocation, that has to absorb all the sweeping itself.
Another alternative is to do the sweeping incrementally, by doing it lazy. Instead of finding all the white cells and linking them to the free list immediately, this is done on each allocation. If there is no free cells in the free list, a little sweeping is done until new space can be found.
This can help minimize pauses for the allocating thread.
Current implementation
The current implementation does an eager sweeping.
Optimization opportunities
The sweeping phase can be made lazy. The only disadvantage I see is (well, besides extra complexity) that could make the heap more likely to be fragmented, because consecutive requests are not necessarily made on the same page (a free() call can add new cells from another page to the free list), making the heap more sparse, (which can be bad for the cache too). But I think this is only possible if free() is called explicitly, and this should be fairly rare in a garbage collected system, so I guess this could worth trying.
Lazy sweeping helps the cache too, because in the sweep phase, you might trigger cache misses when linking to the free list. When sweeping lazily, the cache miss is delayed until it's really necessary (the cache miss will happen anyway when you are allocating the free cell).
Conclusion
Even when the current GC is fairly optimized, there is plenty of room for improvements, even preserving the original global design.
Understanding the current GC, the end
by Leandro Lucarella on 2009- 04- 11 04:46 (updated on 2009- 04- 15 04:10)- with 0 comment(s)
In this post I will take a closer look at the Gcx.mark() and Gcx.fullcollect() functions.
This is a simplified version of the mark algorithm:
mark(from, to)
    changes = 0
    while from < to
        pool = findPool(from)
        offset = from - pool.baseAddr
        page_index = offset / PAGESIZE
        bin_size = pool.pagetable[page_index]
        bit_index = find_bit_index(bin_size, pool, offset)
        if not pool.mark.test(bit_index)
            pool.mark.set(bit_index)
            if not pool.noscan.test(bit_index)
                pool.scan.set(bit_index)
                changes = true
        from++
        anychanges |= changes // anychanges is global
In the original version, there are some optimizations and the find_bit_index() function doesn't exist (it does some bit masking to find the right bit index for the bit set). But everything else is pretty much the same.
So far, is evident that the algorithm don't mark the whole heap in one step, because it doesn't follow pointers. It just marks a consecutive chunk of memory, assuming that pointers can be at any place in that memory, as long as they are aligned (from increments in word-sized steps).
fullcollect() is the one in charge of following pointers, and marking chunks of memory. It does it in an iterative way (that's why mark() informs about anychanges (when new pointer should be followed to mark them, or, speaking in the tri-colour abstraction, when grey cells are found).
fullcollect() is huge, so I'll split it up in smaller pieces for the sake of clarity. Let's see what are the basic blocks (see the second part of this series):
fullcollect()
    thread_suspendAll()
    clear_mark_bits()
    mark_free_list()
    rt_scanStaticData(mark)
    thread_scanAll(mark, stackTop)
    mark_root_set()
    mark_heap()
    thread_resumeAll()
    sweep()
Generaly speaking, all the functions that have some CamelCasing are real functions and the ones that are all_lowercase and made up by me.
Let's see each function.
- thread_suspendAll()
- This is part of the threads runtime (found in src/common/core/thread.d). A simple peak at it shows it uses SIGUSR1 to stop the thread. When the signal is caught it pushes all the registers into the stack to be sure any pointers there are scanned in the future. The threads waits for SIGUSR2 to resume.
- clear_mark_bits()
foreach pool in pooltable pool.mark.zero() pool.scan.zero() pool.freebits.zero()- mark_free_list()
foreach n in B_16 .. B_PAGE foreach node in bucket pool = findPool(node) pool.freebits.set(find_bit_index(pool, node)) pool.mark.set(find_bit_index(pool, node))- rt_scanStaticData(mark)
- This function, as the name suggests, uses the provided mark function callback to scan the program's static data.
- thread_scanAll(mark, stackTop)
- This is another threads runtime function, used to mark the suspended threads stacks. I does some calculation about the stack bottom and top, and calls mark(bottom, top), so at this point we have marked all reachable memory from the stack(s).
- mark_root_set()
mark(roots, roots + nroots) foreach range in ranges mark(range.pbot, range.ptop)- mark_heap()
This is where most of the marking work is done. The code is really ugly, very hard to read (mainly because of bad variable names) but what it does it's relatively simple, here is the simplified algorithm:
// anychanges is global and was set by the mark()ing of the
// stacks and root set
while anychanges
    anychanges = 0
    foreach pool in pooltable
        foreach bit_pos in pool.scan
            if not pool.scan.test(bit_pos)
                continue
            pool.scan.clear(bit_pos) // mark as already scanned
            bin_size = find_bin_for_bit(pool, bit_pos)
            bin_base_addr = find_base_addr_for_bit(pool, bit_pos)
            if bin_size < B_PAGE // small object
                bin_top_addr = bin_base_addr + bin_size
            else if bin_size in [B_PAGE, B_PAGEPLUS] // big object
                page_num = (bin_base_addr - pool.baseAddr) / PAGESIZE
                if bin == B_PAGEPLUS // search for the base page
                    while pool.pagetable[page_num - 1] != B_PAGE
                        page_num--
                n_pages = 1
                while page_num + n_pages < pool.ncommitted
                        and pool.pagetable[page_num + n_pages] == B_PAGEPLUS
                    n_pages++
                bin_top_addr = bin_base_addr + n_pages * PAGESIZE
            mark(bin_base_addr, bin_top_addr)
The original algorithm has some optimizations for proccessing bits in clusters (skips groups of bins without the scan bit) and some kind-of bugs too.
Again, the functions in all_lower_case don't really exist, some pointer arithmetics are done in place for finding those values.
Note that the pools are iterated over and over again until there are no unvisited bins. I guess this is a fair price to pay for not having a mark stack (but I'm not really sure =).
- thread_resumeAll()
- This is, again, part of the threads runtime and resume all the paused threads by signaling a SIGUSR2 to them.
- sweep()
mark_unmarked_free()
rebuild_free_list()
- mark_unmarked_free()
This (invented) function looks for unmarked bins and set the freebits bit on them if they are small objects (bin size smaller than B_PAGE) or mark the entire page as free (B_FREE) in case of large objects.
This step is in charge of executing destructors too (through rt_finalize() the runtime function).
- rebuild_free_list()
This (also invented) function first clear the free list (bucket) and then rebuild it using the information collected in the previous step.
As usual, only bins with size smaller than B_PAGE are linked to the free list, except if the pages they belong to have all the bins freed, in which case the page is marked with the special B_FREE bin size. The same goes for big objects freed in the previous step.
I think rebuilding the whole free list is not necessary, the new free bins could be just linked to the existing free list. I guess this step exists to help reducing fragmentation, since the rebuilt free list group bins belonging to the same page together.
Understanding the current GC, part IV
by Leandro Lucarella on 2009- 04- 10 21:33 (updated on 2009- 04- 10 21:33)- with 0 comment(s)
What about freeing? Well, is much simpler than allocation =)
GC.free(ptr) is a thread-safe wrapper for GC.freeNoSync(ptr).
GC.freeNoSync(ptr) gets the Pool that ptr belongs to and clear its bits. Then, if ptr points to a small object (bin size smaller than B_PAGE), it simply link that bin to the free list (Gcx.bucket). If ptr is a large object, the number of pages used by the object is calculated then all the pages marked as B_FREE (done by Pool.freePages(start, n_pages)).
Then, there is reallocation, which is a little more twisted than free, but doesn't add much value to the analysis. It does what you think it should (maybe except for a possible bug) using functions already seen in this post or in the previous ones.
Understanding the current GC, part III
by Leandro Lucarella on 2009- 04- 10 05:28 (updated on 2009- 04- 10 05:28)- with 0 comment(s)
In the previous post we focused on the Gcx object, the core of the GC in druntime (and Phobos and Tango, they are all are based on the same implementation). In this post we will focus on allocation, which a little more complex than it should be in my opinion.
It was not an easy task to follow how allocation works. A GC.malloc() call spawns into this function calls:
GC.malloc(size, bits)
 |
 '---> GC.mallocNoSync(size, bits)
        |
        |---> Gcx.allocPage(bin_size)
        |      |
        |      '---> Pool.allocPages(n_pages)
        |             |
        |             '---> Pool.extendPages(n_pages)
        |                    |
        |                    '---> os_mem_commit(addr, offset, size)
        |
        |---> Gcx.fullcollectshell()
        |
        |---> Gcx.newPool(n_pages)
        |      |
        |      '---> Pool.initialize(n_pages)
        |             |
        |             |---> os_mem_map(mem_size)
        |             |
        |             '---> GCBits.alloc(bits_size)
        |
        '---> Gcx.bigAlloc(size)
               |
               |---> Pool.allocPages(n_pages)
               |      '---> (...)
               |
               |---> Gcx.fullcollectshell()
               |
               |---> Gcx.minimize()
               |      |
               |      '---> Pool.Dtor()
               |             |
               |             |---> os_mem_decommit(addr, offset, size)
               |             |
               |             |---> os_mem_map(addr, size)
               |             |
               |             '---> GCBits.Dtor()
               |
               '---> Gcx.newPool(n_pages)
                      '---> (...)
Doesn't look so simple, ugh?
The map/commit differentiation of Windows doesn't exactly help simplicity. Note that Pool.initialize() maps the memory (reserve the address space) while Pool.allocPages() (through Pool.extendPages()) commit the new memory (ask the OS to actually reserve the virtual memory). I don't know how good is this for Windows (or put in another way, how bad could it be for Windows if all mapped memory gets immediately committed), but it adds a new layer of complexity (that's not even needed in Posix OSs). The whole branch starting at Gcx.allocPage(bin_size) would be gone if this distinction it's not made. Besides this, it worsen Posix OSs performance, because there are some non-trivial lookups to handle this non-existing non-committed pages, even when the os_mem_commit() and os_mem_decommit() functions are NOP and can be optimized out, the lookups are there.
Mental Note
See if getting rid of the commit()/decommit() stuff improves Linux performance.
But well, let's forget about this issue for now and live with it. Here is a summary of what all this functions do.
Note
I recommend to give another read to the (updated) previous posts of this series, specially if you are not familiar with the Pool concept and implementation.
- GC.malloc(size, bits)
- This is just a wrapper for multi-threaded code, it takes the GCLock if necessary and calls GC.mallocNoSync(size, bits).
- GC.mallocNoSync(size, bits)
This function has 2 different algorithms for small objects (less than a page of 4KiB) and another for big objects.
It does some common work for both cases, like logging and adding a sentinel for debugging purposes (if those feature are enabled), finding the bin size (bin_size) that better fits size (and cache the result as an optimization for consecutive calls to malloc with the same size) and setting the bits (NO_SCAN, NO_MOVE, FINALIZE) to the allocated bin.
- Small objects (bin_size < B_PAGE)
- Looks at the free list (Gcx.bucket) trying to find a page with the minimum bin size that's equals or bigger than size. If it can't succeed, it calls Gcx.allocPage(bin_size) to find room in uncommitted pages. If there still no room for the requested amount of memory, it triggers a collection (Gcx.fullcollectshell()). If there is still no luck, Gcx.newPage(1) is called to ask the OS for more memory. Then it calls again Gcx.allocPage(bin_size) (remember the new memory is just mmap'ped but not commit'ed) and if there is no room in the free list still, an out of memory error is issued.
- Big objects (B_PAGE and B_PAGEPLUS)
- It simply calls Gcx.bigAlloc(size) and issue an out of memory error if that call fails to get the requested memory.
- Gcx.allocPage(bin_size)
- This function linearly search the pooltable for a Pool with an allocable page (i.e. a page already mapped by not yet committed). This is done through a call to Pool.allocPages(1). If a page is found, its bin size is set to bin_size via the Pool's pagetable, and all the bins of that page are linked to the free list (Gcx.bucket).
- Pool.allocPages(n_pages)
- Search for n_pages consecutive free pages (B_FREE) in the committed pages (pages in the pagetable with index up to ncommited). If they're not found, Pool.extendPages(n_pages) is called to commit some more mapped pages to fulfill the request.
- Pool.extendPages(n_pages)
- Commit n_pages already mapped pages (calling os_mem_commit()), setting them as free (B_FREE) and updating the ncommited attribute. If there are not that many uncommitted pages, it returns an error.
- Gcx.newPool(n_pages)
- This function adds a new Pool to the pooltable. It first adjusts the n_pages variable using various rules (for example, it duplicates the current allocated memory until 8MiB are allocated and then allocates 8MiB pools always, unless more memory is requested in the first place, of course). Then a new Pool is created with the adjusted n_pages value and it's initialized calling to Pool.initialize(n_pages), the pooltable is resized to fit the new number of pools (npools) and sorted using Pool.opCmp() (which uses the baseAddr to compare). Finally the minAddr and maxAddr attributes are updated.
- Pool.initialize(n_pages)
- Initializes all the Pool attributes, mapping the requested number of pages (n_pages) using os_mem_map(). All the bit sets (mark, scan, freebits, noscan) are allocated (using GCBits.alloc()) to n_pages * PAGESIZE / 16 bits and the pagetable too, setting all bins to B_UNCOMMITTED and ncommitted to 0.
- Gcx.bigAlloc(size)
This is the weirdest function by far. There are very strange things, but I'll try to explain what I understand from it (what I think it's trying to do).
It first make a simple lookup in the pooltable for n_pages consecutive pages in any existing Pool (calling Pool.allocPages(n_pages) as in Gcx.allocPage()). If this fails, it runs a fullcollectshell() (if not disabled) then calls to minimize() (to prevent bloat) and then create a new pool (calling newPool() followed by Pool.allocPages()). If all that fails, it returns an error. If something succeed, the bin size for the first page is set to B_PAGE and the remaining pages are set to B_PAGEPLUS (if any). If there is any unused memory at the end, it's initialized to 0 (to prevent false positives when scanning I guess).
The weird thing about this, is that a lot of lookups into the pooltable are done in certain condition, but I think they are not needed because there are no changes that can make new room.
I don't know if this is legacy code that never got updated and have a lot of useless lookups or if I'm getting something wrong. Help is welcome!
There is not much to say about os_mem_xxx(), Gcx.minimize() and Gcx.fullcollectshell() functions, they were briefly described in the previous posts of this series. Pool.Dtor() just undo what was done in Pool.initialize().
A final word about the free list (Gcx.bucket). It's just a simple linked list. It uses the first size_t bytes of the free bin to point to the next free bin (there's always room for a pointer in a bin because their minimum size is 16 bytes). A simple structure is used to easy this:
struct List {
    List *next;
}
Then, the memory cell is casted to this structure to use the next pointer, like this:
p = gcx.bucket[bin]
gcx.bucket[bin] = (cast(List*) p).next
I really have my doubts if this is even a little less cryptic than:
p = gcx.bucket[bin]
gcx.bucket[bin] = *(cast(void**) p)
But what the hell, this is no really important =)
Understanding the current GC, part II
by Leandro Lucarella on 2009- 04- 06 00:00 (updated on 2009- 04- 15 04:10)- with 0 comment(s)
Back to the analysis of the current GC implementation, in this post I will focus on the Gcx object structure and methods.
Gcx attributes
- Root set
- roots (nroots, rootdim)
- An array of root pointers.
- ranges (nranges, rangedim)
- An array of root ranges (a range of memory that should be scanned for root pointers).
- Beginning of the stack (stackBottom)
- A pointer to the stack bottom (assuming it grows up).
- Pool table (pooltable, npools)
- An array of pointers to Pool objects (the heap itself).
- Free list (bucket)
- A free list for each Bins size.
- Internal state
- anychanges
- Set if the marking of a range has actually marked anything (and then using in the full collection.
- inited
- Set if the GC has been initialized.
- Behaviour changing attributes
- noStack
- Don't scan the stack if activated.
- log
- Turn on logging if activated.
- disabled
- Don't run the collector if activated.
- Cache (for optimizations and such)
- p_cache, size_cache
- Querying the size of a heap object is an expensive task. This caches the last query as an optimization.
- minAddr, maxAddr
- All the heap is in this range. It's used as an optimization when looking if a pointer can be pointing into the heap (if the pointer is not in this range it can be safely discarded, but if it's in the range, a full search in the pooltable should be done).
Gcx main methods
- initialize()
- Initialization, set the Gcx object attributes to 0, except for the stackBottom (which is set to the address of a dummy local variable, this works because this function is one of the first functions called by the runtime) and the inited flag, that is set to 1. The log is initialized too.
- Dtor()
- Destruction, free all the memory.
- Root set manipulation
- addRoot(p), removeRoot(p), rootIter(dg)
- Add, remove and iterate over single root pointers.
- addRange(pbot, ptop), remove range(pbot), rangeIter(dg)
- Add, remove and iterate over root pointer ranges. This methods are almost the same as the previous ones, so the code duplication here can be improved here.
- Flags manipulation
Each Bin has some flags associated (as explained before). With this functions the user can manipulate some of them:
- FINALIZE: this pool has destructors to be called (final flag)
- NO_SCAN: this pool should not be scanned for pointers (noscan flag)
- NO_MOVE: this pool shouldn't be moved (not implemented)
- getBits(pool, biti)
- Get which of the flags specified by biti are set for the pool Pool.
- setBits(pool, mask)
- Set the flags specified by mask for the pool Pool.
- clrBits(pool, mask)
- Clear the flags specified by mask for the pool Pool.
- Searching
- findPool(p)
- Find the Pool object that pointer p is in.
- findBase(p)
- Find the base address of block containing pointer p.
- findSize(p)
- Find the size of the block pointed by p.
- getInfo(p)
- Get information on the pointer p. The information is composed of: base (the base address of the block), size (the size of the block) and attr (the flags associated to the block, as shown in Flag manipulation). This information is returned as a structure called the BlkInfo.
- findBin(size)
- Compute Bins (bin size) for an object of size size.
- Heap (pagetable) manipulation
The pooltable is kept sorted always.
- reserve(size)
- Allocate a new Pool of at least size bytes.
- minimize()
- Minimizes physical memory usage by returning free pools to the OS.
- bigAlloc(size)
- Allocate a chunk of memory that is larger than a page.
- newPool(npages)
- Allocate a new Pool with at least npages pages in it.
- allocPage(bin)
- Allocate a page of bin size.
- Collection
- mark(pbot, ptop)
This is the mark phase. It search a range of memory values and mark any pointers into the GC heap. The mark bit is set, and if the noscan bit is unset, the scan bit is activated (indicating that the block should be scanned for pointers, equivalent to coloring the cell grey in the tri-colour abstraction).
The mark phase is not recursive (nor a mark stack is used). Only the passed range is marked, pointers are not followed here.
That's why the anychanges flag is used, if anything has got marked, anychanges is set to true. The marking phase is done iteratively until no more blocks are marked, in which case we can safely assume that we marked all the live blocks.
- fullcollectshell()
- The purpose of the shell is to ensure all the registers get put on the stack so they'll be scanned.
- fullcollect(stackTop)
Collect memory that is not referenced by the program. The algorithm is something like this:
- Stop the world (all other threads)
- Clear all the mark/scan bits in the pools
- Manually mark each free list entry (bucket), so it doesn't get scanned
- mark() the static data
- mark() stacks and registers for each paused thread
- mark() the root set (both roots and ranges)
- mark() the heap iteratively until no more changes are detected (anychanges is false)
- Start the world (all other threads)
- Sweep (free up everything not marked)
- Free complete pages, rebuild free list
Note
This is a very summarized version of the algorithm, what I could understand from a quick look into the code, which is pretty much undocumented. A deeper analysis should be done in a following post.
TODO list
by Leandro Lucarella on 2009- 04- 05 06:42 (updated on 2009- 04- 05 06:42)- with 0 comment(s)
I've activated the issue tracker module in my D Garbage Collector Research project to be able to track my TODO list.
This is probably useful just for me, but maybe you can be interested in knowing what I will do next =)
GC optimization for contiguous pointers to the same page
by Leandro Lucarella on 2009- 04- 01 23:41 (updated on 2009- 04- 01 23:41)- with 0 comment(s)
This optimization had a patch, written by Vladimir Panteleev, sitting on Bugzilla (issue #1923) for a little more than an year now. It was already included in both Tango (issue #982) and DMD 2.x but DMD 1.x was missing it.
Fortunately is now included in DMD 1.042, released yesterday.
This optimization is best seen when you do word splitting of a big text (as shown in the post that triggered the patch):
import std.file, std.string;
void main() {
    auto txt = cast(string) read("text.txt"); // 6.3 MiB of text
    auto words = txt.split();
}
Now in words we have an array of slices (a contiguous area in memory filled with pointers) about the same size of the original text, as explained by Vladimir.
The GC heap is divided in (4KiB) pages, each page contains cells of a fixed type called bins. There are bin sizes of 16 (B_16) to 4096 (B_PAGE), incrementing in steps of power of 2 (32, 64, etc.). See Understanding the current GC for more details.
For large contiguous objects (like txt in this case) multiple pages are needed, and that pages contains only one bin of size B_PAGEPLUS, indicating that this object is distributed among several pages.
Now, back with the words array, we have a range of about 3 millions interior pointers into the txt contiguous memory (stored in about 1600 pages of bins with size B_PAGEPLUS). So each time the GC needs to mark the heap, it has to follow this 3 millions pointers and find out where is the beginning of that block to see its mark-state (if it's marked or not). Finding the beginning of the block is not that slow, but when you multiply it by 3 millions, it could get a little noticeable. Specially when this is done several times as the dynamic array of words grow and the GC collection is triggered several times, so this is kind of exponential.
The optimization consist in remembering the last page visited if the bin size was B_PAGE or B_PAGEPLUS, so if the current pointer being followed points to the last visited (cached) page, we can skip this lookup (and all the marking indeed, as we know we already visited that page).
Mercurial is not good enough
by Leandro Lucarella on 2009- 04- 01 02:55 (updated on 2009- 04- 01 02:55)- with 0 comment(s)
I started learning some Mercurial for interacting with the LDC repository, but I disliked it instantly. Sure, it's great when you come from SVN, but it's just too limited if you come from GIT (I can't live anymore without git rebase -i).
Fortunately there is fast-export. With it I can incrementally import the Mercurial repository in a GIT repository as easy as:
hg clone http://hg.dsource.org/projects/ldc ldc-hg
mkdir ldc
cd ldc
git init
hg-fast-export.sh -r my_local_hg_repo_clone
I'm very happy to be at home again =)
LDC
by Leandro Lucarella on 2009- 03- 29 18:56 (updated on 2009- 03- 29 18:56)- with 0 comment(s)
My original plan was to use GDC as my compiler of choice. This was mainly because DMD is not free and there is a chance that I need to put my hands in the compiler guts.
This was one or two years ago, now the situation has changed a lot. GDC is dead (there was no activity for a long time, and this added to the fact that GCC hacking is hard, it pretty much removes GDC from the scene for me).
OTOH, DMD now provides full source code of the back-end (the front-end was released under the GPL/Artistic licence long ago), but the license is really unclear about what can you do with it. Most of the license mostly tell you how you can never, never, never sue Digital Mars, but about what you can actually do, it's says almost nothing:
The Software is copyrighted and comes with a single user license, and may
not be redistributed. If you wish to obtain a redistribution license,
please contact Digital Mars.
You can't redistribute it, that's for sure. It says nothing about modifications. Anyways, I don't think Walter Bright mind to give me permission to modify it and use it for my personal project, but I prefer to have a software with a better license to work with (and I never was a big fan of Walter's coding either, so =P).
Fortunately there is a new alternative now: LDC. You should know by now that LDC is the DMD front-end code glued to the LLVM back-end, that there is an alpha release (with much of the main functionality finished), that it's completely FLOSS and that it's moving fast and getting better every day (a new release is coming soon too).
I didn't play with LLVM so far, but all I hear about it is that's a nice, easy to learn and work, compiler framework that is widely used, and getting better and better very fast too.
To build LDC just follow the nice instructions (I'm using Debian so I just had to aptitude install cmake cmake-curses-gui llvm-dev libconfig++6-dev mercurial and go directly to the LDC specific part). Now I just have to learn a little about Mercurial (coming from GIT it shouldn't be too hard), and maybe a little about LLVM and I'm good to go.
So LDC is my compiler of choice now. And it should be yours too =)
Collected newsgroup links
by Leandro Lucarella on 2009- 03- 29 04:05 (updated on 2009- 03- 29 04:05)- with 0 comment(s)
I've been monitoring and saving interesting (GC related mostly) posts from the D newsgroups. I saved all in a plain text file until today that I decided to add them to a page.
Please feel free to add any missing post that include interesting GC-related discussions.
Thanks!
D GC Benchmark Suite
by Leandro Lucarella on 2009- 03- 28 18:31 (updated on 2009- 03- 28 18:31)- with 0 comment(s)
I'm trying to make a benchmark suite to evaluate different GC implementations.
What I'm looking for is:
- Trivial benchmarks that stress corner cases or very specific scenarios. For example, I collected a few of this posted in the NG and other sources in the couple last years (most showing problems already solved):
- Working real-life programs, specially if they are GC-intensive (for example programs where pause times are a problem and they are visible to the user) and they are easy to get timings for (but not limited to that). Programs should be opensource in principle, but if they are not please contact me if you are willing to lend me the code for this research at least. I don't know yet if I will be targeting D1, D2 or both (probably D1), so feel free to submit anything. The only condition is the program should compile (and work) with the latest compiler/Tango versions.
Feel free to post trivial test or links to programs projects as comments or via e-mail.
Thanks!
Accurate Garbage Collection in an Uncooperative Environment
by Leandro Lucarella on 2009- 03- 21 20:23 (updated on 2009- 03- 22 03:05)- with 0 comment(s)
I just read Accurate Garbage Collection in an Uncooperative Environment paper.
Unfortunately this paper try to solve mostly problems D don't see as problems, like portability (targeting languages that emit C code instead of native machine code, like the Mercury language mentioned in the paper). Based on the problem of tracing the C stack in a portable way, it suggests to inject some code to functions to construct a linked list of stack information (which contains local variables information) to be able to trace the stack in an accurate way.
I think none of the ideas presented by this paper are suitable for D, because the GC already can trace the stack in D (in an unportable way, but it can), and it can get the type info from better places too.
In terms of (time) performance, benchmarks shows that is a little worse than Boehm (et al) GC, but they argue that Boehm has years of fine grained optimizations and it's tightly coupled with the underlying architecture while this new approach is almost unoptimized yet and it's completely portable.
The only thing it mentions that could apply to D (and any conservative GC in general) is the issues that compiler optimizations can introduce. But I'm not aware of any of this issues, so I can't say anything about it.
In case you wonder, I've added this paper to my papers playground page =)
Update
I think I missed the point with this paper. Current D GC can't possibly do accurate tracing of the stack, because there is no way to get a type info from there (I was thinking only in the heap, where some degree of accuracy is achieved by setting the noscan bit for a bin that don't have pointers, as mentioned in my previous post).
So this paper could help getting accurate GC into D, but it doesn't seems a great deal when you can add type information about local variables when emitting machine code instead of adding the shadow stack linked list. The only advantage I see is that I think it should be possible to implement the linked list in the front-end.
Understanding the current GC
by Leandro Lucarella on 2009- 01- 04 20:37 (updated on 2009- 04- 09 22:53)- with 1 comment(s)
Oh, yeah! A new year, a new air, and the same thesis =)
After a little break, I'm finally starting to analyze the current D (druntime) GC (basic) implementation in depth.
First I want to say I found the code really, but really, hard to read and follow. Things are split in several parts without apparent reason, which make it really hard to understand and it's pretty much undocumented.
I hope I can fully understand it in some time to be able to make a full rewrite of it (in a first pass, conserving the main design).
Overview
I'll start with a big picture overview, and then I'll try to describe each component with more detail.
The implementation in split in several files:
- gcstats.d
- I didn't took a look at this one yet, but I guess it's about stats =).
- gcbits.d
- A custom bitset implementation for collector bit/flags (mark, scan, etc.).
- gcalloc.d
- A wrapper for memory allocation with several versions (malloc, win32, mmap and valloc). 4 functions are provided: map, unmap, commit and decommit. The (de)commit stuff if because (in Sean Kelly's words) Windows has a 2-phase allocation process. You can reserve the address space via map and unmap, but the virtual memory isn't actually created until you call commit. So decommit gets rid of the virtual memory but retains ownership of the address space.
- gcx.d
- The real GC implementation, split in 2 main classes/structs: GC and Gcx. GC seems to be a thin wrapper over Gcx that only provides the allocation logic (alloc/realloc/free) and Gcx seems to be the responsible for the real GC work (and holding the memory).
- gc.d
- This is just a thin wrapper over gcx.d to adapt it to the druntime GC interface.
The Gcx struct is where most magic happens. It holds the GC memory organized in pools. It holds the information about roots, the stack and free list, but in this post I'll focus in the memory pools:
Pool Concept
A pool is a group of pages, each page has a bin size (Bins) and host a fixed number of bins (PAGESIZE / Bins, for example, if Bins == 1024 and PAGESIZE == 4096, the page holds 4 bins).
Each bin has some bits of information:
- mark
- Setted when the Bin is visited by the mark phase.
- scan
- Setted when the Bin is has been visited by the mark phase (the mark bit is set) but it has pointers yet to be scanned.
- free
- Setted when the Bin is free (linked to a free list).
- final
- The object stored in this bin has a destructor that must be called when freed.
- noscan
- This bin should be not scanned by the collector (it has no pointers).
+----------------------------------------+-----+-----------------+
| Page 0 (bin size: Bins)                | ... | Page (npages-1) |
|                                        |     |                 |
| +--------+-----+---------------------+ |     |                 |
| | Bin 0  | ... | Bin (PAGESIZE/Bins) | |     |                 |
| +--------+-----+---------------------+ |     |                 |
| | mark   | ... |                     | |     |                 |
| | scan   | ... |                     | |     |       ...       |
| | free   | ... |         ...         | |     |                 |
| | final  | ... |                     | |     |                 |
| | noscan | ... |                     | |     |                 |
| +--------+-----+---------------------+ |     |                 |
+----------------------------------------+-----+-----------------+
Pool Implementation
A single chunk of memory is allocated for the whole pool, the baseAddr points to the start of the chunk, the topAddr, to the end. A pagetable holds the bin size (Bins) of each page
.          ,-- baseAddr                                   topAddr --,
           |                   ncommitted = i                       |
           |                                                        |
           |--- committed pages ---,------ uncommitted pages -------|
           V                       |                                V
           +--------+--------+-----+--------+-----+-----------------+
    memory | Page 0 | Page 1 | ... | Page i | ... | Page (npages-1) |
           +--------+--------+-----+--------+-----+-----------------+
               /\       /\      /\     /\      /\          /\
               ||       ||      ||     ||      ||          ||
           +--------+--------+-----+--------+-----+-----------------+
 pagetable | Bins 0 | Bins 1 | ... | Bins i | ... | Bins (npages-1) |
(bin size) +--------+--------+-----+--------+-----+-----------------+
The bin size can be one of:
- B_XXX
- The XXX is a power of 2 from 16 to 4096. The special name B_PAGE is used for the size 4096.
- B_PAGEPLUS
- The whole page is a continuation of a large object (the first page of a large object has size B_PAGE).
- B_FREE
- The page is completely free.
- B_UNCOMMITED
- The page is not committed yet.
- B_MAX
- Not really a value, used for iteration or allocation. Pages can't have this value.
The information bits are stored in a custom bit set (GCBits). npages * PAGESIZE / 16 bits are allocated (since the smallest bin is 16 bytes long) and each bit is addressed using this formula:
bit(pointer) = (pointer - baseAddr) / 16
This means that a bit is reserved each 16 bytes. For large bin sizes, a lot of bits are wasted.
The minimum pool size is 256 pages. With 4096 bytes pages, that is 1 MiB.
The GCBits implementation deserves another post, it's a little complex and I still don't understand why.
druntime developers FAQ
by Leandro Lucarella on 2008- 12- 05 11:38 (updated on 2008- 12- 05 11:38)- with 0 comment(s)
Improved druntime getting started documentation
by Leandro Lucarella on 2008- 12- 02 23:07 (updated on 2008- 12- 02 23:07)- with 0 comment(s)
I've expanded the druntime Getting Started documentation. I basically added all the information I've posted in this blog so far: how to change the GC implementation and rebuild phobos.
Testing druntime modifications
by Leandro Lucarella on 2008- 11- 30 03:51 (updated on 2008- 11- 30 03:51)- with 0 comment(s)
Now that we can compile druntime, we should be able to compile some programs that use our fresh, modified, druntime library.
Since DMD 2.021, druntime is built into phobos, so if we want to test some code we need to rebuild phobos too, to include our new druntime.
Since I'm particularly interested in the GC, let's say we want to use the GC stub implementation (instead of the basic default).
We can add a simple "init" message to see that something is actually happening. For example, open src/gc/stub/gc.d and add this import:
private import core.sys.posix.unistd: write;
Then, in the gc_init() function add this line:
write(1, "init\n".ptr, 5);
Now, we must tell druntime we want to use the stub GC implementation. Edit dmd-posix.mak, search for DIR_GC variable and change it from basic to stub:
DIR_GC=gc/stub
Great, now recompile druntime.
Finally, go to your DMD installation, and edit src/phobos/linux.mak. Search for the DRUNTIME variable and set it to the path to your newly generated libdruntime.a (look in the druntime lib directory). For me it's something like:
DRUNTIME=/home/luca/tesis/druntime/lib/libdruntime.a
Now recompile phobos. I have to do this, because my DMD compiler is named dmd2:
make -f linux.mak DMD=dmd2
Now you can compile some trivial D program (compile it in the src druntime directory so its dmd.conf is used to search for the libraries and imports) and see how "init" get printed when the program starts. For example:
druntime/src$ cat hello.d

import core.sys.posix.unistd: write;

void main()
{
    write(1, "hello!\n".ptr, 7);
}

druntime/src$ dmd2 -L-L/home/luca/tesis/dmd2/lib hello.d
druntime/src$ ./hello
init
hello!
Note that I passed my DMD compiler's lib path so it can properly find the newly created libphobos2.a.
druntime build system
by Leandro Lucarella on 2008- 11- 26 02:28 (updated on 2008- 11- 26 02:28)- with 0 comment(s)
I have to be honest on this one. I'm not crazy about the druntime build system. I know there are a lot of other more important thing to work on, but I can't help myself, and if I'm not comfortable with the build system, I get too much distracted, so I have no choice but to try to improve it a little =)
First, I don't like the HOME environment variable override hack in build-dmd.sh (I won't talk about the Windows build because I don't have Windows, so I can't test it).
So I've made a simple patch to tackle this. It just adds a dmd.conf configuration file in each directory owning a makefile. I think it's a fair price to pay adding this extra files to be hable to just use make and get rid of the build-dmd.sh script.
I've added a ticket on this and another related ticket with a patch too.
Getting started with druntime
by Leandro Lucarella on 2008- 11- 25 02:27 (updated on 2008- 11- 25 02:27)- with 0 comment(s)
I've added a brief draft about how to get started in the druntime wiki, which I plan to expand a little in the future.
I hope somebody find it useful.
BTW, the -version=Posix fix is now included in the main repo.
My druntime repository
by Leandro Lucarella on 2008- 11- 24 02:17 (updated on 2008- 11- 24 02:17)- with 0 comment(s)
I've finally published my own git druntime repository. It has both branches, the one for D2 (the svn trunk, called master in my repo) and the one for D1 (D1.0 in svn, d1 in my repo).
For now, there are only changes in the master branch.
Hacking druntime
by Leandro Lucarella on 2008- 11- 22 16:38 (updated on 2009- 03- 28 20:17)- with 0 comment(s)
I've been reading the source code of the druntime, and it's time to get my hands dirty and do some real work.
First I have to do to start hacking it is build it and start trying things out. There is no documentation at all yet, so I finally bothered Sean Kelly and asked him how to get started.
Here is what I had to do to get druntime compiled:
First of all, I'll introduce my environment and tools. I'll use DMD because there's no other option for now (druntime doesn't have support for GDC, but Sean says it's coming soon, and LDC will not be included until the support it's added to Tango runtime).
The trunk in the druntime repository is for D2, but there is a branch for D1 too.
I use Debian (so you'll see some apt stuff here) and I love git, and there's is no way I will go back to subversion. Fortunately there is git-svn, so that's what I'm gonna use =)
Now, what I did step by step.
Get the git goodies:
sudo aptitude install git-core git-svn
Make a directory where to put all the D-related stuff:
mkdir ~/d
cd ~/d
Get D2 (bleeding edge version) and unpack it:
wget http://ftp.digitalmars.com/dmd.2.026.zip
unzip dmd.2.020.zip # "install" the D2 compiler
rm -fr dm dmd/linux/bin/{sc.ini,readme.txt,*.{exe,dll,hlp}} # cut the fat
chmod a+x dmd/linux/bin/{dmd,rdmd,dumpobj,obj2asm} # make binaries executable
mv dmd dmd2 # reserve the dmd directory for D1 compiler
Make it accessible, for example:
echo '#!/bin/sh' > ~/bin/dmd2 # reserve dmd name for the D1 compiler
echo 'exec ~/d/dmd2/linux/bin/dmd "$@"' >> ~/bin/dmd2
chmod a+x ~/bin/dmd2
Get D1 and install it too:
wget http://ftp.digitalmars.com/dmd.1.041.zip
unzip dmd.1.036.zip
rm -fr dm dmd/linux/bin/{sc.ini,readme.txt,*.{exe,dll,hlp}}
chmod a+x dmd/linux/bin/{dmd,rdmd,dumpobj,obj2asm}
echo '#!/bin/sh' > ~/bin/dmd
echo 'exec ~/d/dmd/linux/bin/dmd "$@"' >> ~/bin/dmd
chmod a+x ~/bin/dmd
Get druntime for D1 and D2 as separated repositories (you can get all in one git repository using git branches but since I'll work on both at the same time I prefer to use two separated repositories):
git svn clone http://svn.dsource.org/projects/druntime/branches/D1.0 \
  druntime
git svn clone http://svn.dsource.org/projects/druntime/trunk druntime2
Build druntime for D1:
cd druntime
bash build-dmd.sh
cd -
Build druntime for D2.
This one is a little trickier. The trunk version have some changes for a feature that is not yet released (this being changed from a pointer to a reference for structs). Fortunately this is well isolated in a single commit, so reverting this change is really easy, first, get the abbreviated hash for the commit 44:
cd druntime2
git log --grep='trunk@44' --pretty=format:%h
This should give you a small string (mine is cae2326). Now, revert that change:
git revert cae2326
Done! You now have that change reverted, we can remove this new commit later when the new version of DMD that implements the this change appear.
But this is not all. Then I find a problem about redefining the Posix version:
Error: version identifier 'Posix' is reserved and cannot be set
To fix this you just have to remove the -version=Posix from build-dmd.sh.
But there is still one more problem, but this is because I have renamed the bianries to have both dmd and dmd2. The compiler we have to use to build things is called dmd2 for me, but build-dmd.sh don't override properly the DC environment variable when calling make, so dmd is used instead.
This is a simple and quick fix:
diff --git a/src/build-dmd.sh b/src/build-dmd.sh
old mode 100644
new mode 100755
index d6be599..8f3b163
--- a/src/build-dmd.sh
+++ b/src/build-dmd.sh
@@ -11,9 +11,10 @@ goerror(){
     exit 1
 }

-make clean -fdmd-posix.mak           || goerror
-make lib doc install -fdmd-posix.mak || goerror
-make clean -fdmd-posix.mak           || goerror
+test -z "$DC" && DC=dmd
+make DC=$DC clean -fdmd-posix.mak           || goerror
+make DC=$DC lib doc install -fdmd-posix.mak || goerror
+make DC=$DC clean -fdmd-posix.mak           || goerror
 chmod 644 ../import/*.di             || goerror

 export HOME=$OLDHOME
(to apply the patch just copy&paste it to fix.patch and then do git apply fix.patch; that should do the trick)
Now you can do something like this to build druntime for D2:
export DC=dmd2
bash build-dmd.sh
That's it for now. I'll be publishing my druntime (git) repository soon with this changes (and probably submitting some patches to upstream) so stay tuned ;)
Richard Jones GC book figures
by Leandro Lucarella on 2008- 10- 22 00:21 (updated on 2008- 10- 22 01:01)- with 0 comment(s)
Yesterday Richard Jones announced the publication of all the figures of the GC book he co-authored.
This is very nice news indeed =)
PS: Yes, I'm still alive, just very busy =( I took a look at the D's GC, but I'm waiting too for all the fuzz about the new druntime to settle a little to ask Sean Kelly some questions about it's internals
Mark-Sweep
by Leandro Lucarella on 2008- 09- 16 02:25 (updated on 2008- 09- 16 02:25)- with 0 comment(s)
After a busy week (unfortunately not working on my thesis), I'll move on to mark-sweep algorithms (I've covered the basic reference counting stuff for now).
The GC book start with some obvious optimizations about making the marking phase non recursive using an explicit stack and methods to handle stack overflow.
Since current D's GC is mark-sweep, I think I have to take a (deeper) look at it now, to see what optimizations is actually using (I don't think D GC is using the primitive recursive algorithm) and take that as the base ground to look for improvements.
The Python's algorithm
by Leandro Lucarella on 2008- 09- 08 02:05 (updated on 2008- 09- 08 02:05)- with 0 comment(s)
Python (at least CPython) uses reference counting, and since version 2.0 it includes a cycles freeing algorithm. It uses a generational approach, with 3 generations.
Python makes a distinction between atoms (strings and numbers mostly), which can't be part of cycles; and containers (tuples, lists, dictionaries, instances, classes, etc.), which can. Since it's unable to find all the roots, it keeps track of all the container objects (as a double linked list) and periodically look in them for cycles. If somebody survive the collection, is promoted to the next generation.
I think this works pretty well in real life programs (I never had problems with Python's GC -long pauses or such-, and I never heard complains either), and I don't see why it shouldn't work for D. Even more, Python have an issue with finalizers which don't exist in D because you don't have any warranties about finalization order in D already (and nobody seems to care, because when you need to have some order of finalization you should probably use some kind of RAII).
Partial mark and sweep cycle reclamation
by Leandro Lucarella on 2008- 09- 07 18:26 (updated on 2008- 09- 07 18:26)- with 0 comment(s)
This is a more polished version of the last idea about adding a backup tracing GC to collect cycles. We just trace the areas of the heap that can potentially store cycles (instead of tracing all the heap).
So, how do we know which areas may have cycles? When a reference counter is decremented, if it becomes zero, it can't possibly part of a cycle, but when the counter is decremented 1 or more, you never know. So the basics for the algorithm is to store cells which counters have been decremented to 1 or more, and then make a local (partial) mark and sweep to the cell accessible from it.
The trick is to use the reference counters. In the marking phase, the reference counters are decremented as the connectivity graph is traversed. When the marking phase is done, any cell with counter higher than zero is reference from outside the partial graph analyzed, so it must survive (as well as all the cells reachable from it).
Note
The worst case for a partial scan, is to scan the whole heap. But this should be extremely rare.
There are a lot of flavors of this algorithm, but all are based on the same principle, and most of the could be suitable for D.
Backup tracing collector for rc cycles reclamation
by Leandro Lucarella on 2008- 09- 07 04:05 (updated on 2009- 04- 02 21:42)- with 0 comment(s)
The simpler way to reclaim cycles is to use a backup tracing garbage collector. But this way, even when GC frequency could be much lower, the infomation of reference counters are not used, and pauses can be very long (depending on the backup algorithm used).
I think some kind of mixture between RC and tracing GC could be done so I wont discard this option just yet, but I think more specialized algorithms can do better in this case.
Discarded cycles reclamation algorithms
by Leandro Lucarella on 2008- 09- 07 03:50 (updated on 2008- 09- 07 03:50)- with 0 comment(s)
Finally, we address the cyclic structures reclaimation when doing reference counting. But I think there are some algorithms that are clearly unsuitable for D.
All the manual techniques (manually avoiding or breaking cycles or using weak pointers) are unacceptable, because it throws the problem again to the programmer. So I will consider only the options that keep the memory management automatic.
There are several specific cycles reclamation algorithms for functional languages too (like Friedman and Wise), but of course they are unsuitable for D because of the asumptios they make.
Bobrow proposed a general technique, in which a cyclic structure is reference counted as a whole (instead of reference counting their individual cells) but I find this impractical for D too, because it needs programmer intervention (marking "group" of cells).
ZCT and cycles
by Leandro Lucarella on 2008- 08- 30 16:08 (updated on 2008- 08- 30 16:08)- with 0 comment(s)
There's not much to think about it (I think ;).
ZCT doesn't help in cycles reclaiming, because ZCT tracks cells with zero count, and cycles can't possibly have a zero count (even using deferred reference counting), because they are, by definition, inter-heap pointers.
Let's see a simple example:
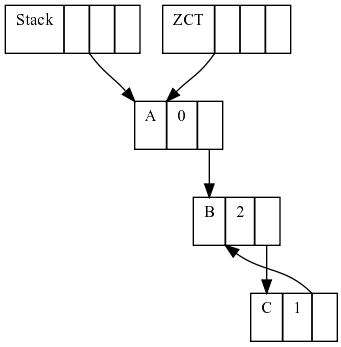
First, we have 3 heap cells, A pointed only by the (thus with rc 0 and added to the ZCT) and B pointed by A and in a cycle with C.
If sometime later, A stop pointing to B, the cycle B-C is not pointed by anything (the ZCT can't do anything about it either), so we lost track of the cycle.
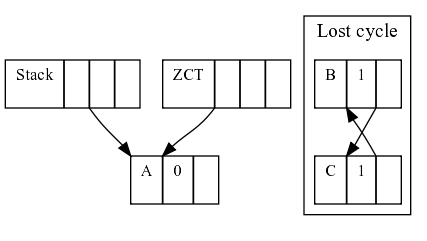
Does this mean that deferred reference counting is useless? I think not. It could still be useful to do some kind of incremental garbage collection, minimizing pauses for a lot of cases. As long as the ZCT reconciliation can find free cells, the pauses of GC would be as short as tracing only the stack, which I think it would be pretty short.
Mental note
See how often cycles are found in tipical D programs.
If the ZCT reconciliation can't find free cells, a full collection should be triggered, using a tracing collector to inspect both the stack and the heap. Alternatively, one can a potential cycle table to store cells which rc has been decremented to a value higher than zero, and then just trace those cells to look for cycles, but we will see this algorithm in more detail in the future.
Avoiding counter updates
by Leandro Lucarella on 2008- 08- 25 03:44 (updated on 2008- 08- 25 03:44)- with 0 comment(s)
The main drawback of reference counting (leaving cycle aside) probably is high overhead it imposes into the client program. Every pointer update has to manipulate the reference counters, for both the old and the new objects.
Function calls
This includes every object passed as argument to a function, which one can guess it would be a lot (every method call for example). However, this kind of rc updates can be easily optimized away. Let's see an example:
class SomeClass
{
    void some_method() {}
}

void some_function(SomeClass o)
{
    o.some_method();
}

void main()
{
    auto o = new SomeClass;
    some_function(o);
}
It's clear that o should live until the end of main(), and that there is no chance o could be garbage collected until main() finishes. To express this, is enough to have o's rc = 1. There is no need to increment it when some_function() is called, nor when some_method() is called.
So, theoretically (I really didn't prove it =) is not necessary to update object's rc when used as arguments.
Local pointers update
What about pointers in the stack? Most of the time, pointers updates are done in local variables (pointers in the stack, not in the heap). The GC book talks about 99% of pointers update done in local variables for Lisp and ML. I don't think D could have that much but I guess it could be pretty high too.
Mental note
Gather some statistics about the number of local pointers update vs. heap pointers update in D
Fortunately Deutsch and Bobrow created an algorithm to completely ignore local pointers update, at the cost of relaying on some kind of tracing collector, but that only have to trace the stack (which should be pretty small compared to the heap).
What the algorithm proposes is to use simple assignment when updating local pointers. Pointers living in the heap manipulates rc as usual, but when the count drops to 0, the object is added to a zero count table (ZCT) (and removed if some pointer update increments the counter again).
Finally, at some point (usually when you run out of memory), the ZCT has to be reconciled, doing some simple steps: trace the stack looking for pointers and incrementing their counters and remove any object with rc = 0. Finally, decrement all the counters of the objects pointer to by the stack pointers.
This technique seems to be a good mix of both reference counting and tracing collectors: small pauses (the stack is usually small), low overhead for counter manipulation. The only missing point is cycles. At first sight, if we need a tracing collector for cycles, this algorithm seems pretty useless because you have to trace all the heap and stack to free cycles, so the optimization is lost. Big pauses are here again.
I have the feeling I'm missing something and the ZCT could be useful when comes to reclaim cycles, but I have to think a little more about that.
Lazy freeing RC
by Leandro Lucarella on 2008- 08- 19 02:31 (updated on 2008- 08- 19 02:31)- with 0 comment(s)
The first optimization to analyze is a very simple one. What's the idea behind it lazy freeing? Just transfer some of the work of freeing unused cells to the allocation, making the collection even more interleaved with the mutator.
When you delete a cell, if it's counter drops to 0, instead of recursively free it, just add it to a free-list. Then, when a new cell has to be allocated, take it from the free-list, delete all its children (using the lazy delete, of course), and return that cell.
First drawback of this method: you loose finalization support, but as I said, most people don't care about that. So that's a non-problem. Second, allocation is not that fast anymore. But it's almost bounded. Why almost? Because it's O(N), being N the number of pointers to be deleted in that cell. This doesn't seems like a huge cost anyways (just decrement a counter and, maybe, add it to a free-list). Allocation is (usually) not bounded anyways (except for compacting collectors).
The big win? Bounded freeing. Really small pauses, with no extra costs.
Note
If you have a (simple) program that suffers from GC pauses that you think it could be easily converted to be reference counted (i.e. few pointer updates), please let me know if you want me to try to make it use lazy freeing RC to analyze the real impact on a real-life program.
Reference counting worth a try
by Leandro Lucarella on 2008- 08- 18 23:30 (updated on 2008- 08- 19 02:19)- with 0 comment(s)
Even when I said that reference counting (RC) will be hard in D, I think it worth a try because it's a really easy way to get incremental garbage collection; the collector activity is interleaved with the mutator. And besides it could be hard to add support to the compiler, it's doable by manually incrementing and decrementing the reference counters to evaluate it.
One of the biggest features of RC is its capability to identify garbage cells as soon as they become garbage (let cycles outside that statement =). The killer use for this is finalization support. Unfortunately this feature kills a lot of possible optimizations. On the other hand, D doesn't need finalization support very hard (with the scope statement and other possible RAII D techniques, I think nobody is missing it), so, lucky us, we can drop that feature and think about some optimizations.
RC can help too to all the fuzz about concurrency and sharing in D2 (it's trivial to know when an object is unshared), but that's a different story.
Note
By the way, I don't think RC can make it on his own (yes, because of cycles), but I think it can help a lot to make collection incremental, leaving just a very small ammount of work to a tracing collector.
Basic algorithms summary
by Leandro Lucarella on 2008- 08- 12 03:42 (updated on 2008- 08- 12 04:26)- with 6 comment(s)
Let's make a little summary about the big categories of garbage collection algorithms:

The first branch is reference counting vs. tracing garbage collectors. For D, reference counting is a really complicated choice, because to be (seriously) considered, the compilar/language have to change pretty much. However, one can make some manual bookkeeping to evaluate if this method has considerable advantages over the other to see if that extra work worth the effort.
Tracing garbage collectors is the easy way to go in D. Tracing comes in two flavors: moving and non-moving. Again, moving is hard in D, because all sort of nasty stuff can be done, but a lot more doable than reference counting. In the non-moving field, the major option is the good ol' mark & sweep (the algorithm used by the actual D garbage collector).
Going back to the moving ones, there are two big groups: copying and mark-compact. I don't like copying too much because it need at least double the residency of a program (remember, we are trying not to waste memory =). Mark-compact have some of the advantages of copying without this requirement.
Note
This is just one arbitrary categorization. There are a lot of other categories based on different topis, like: pauses (stop-the-world, incremental, concurrent, real-time), partitioning (generational, connectivity-based), pointer-awareness (precise, conservative) and probably a lot more that I don't even know.
Post your favorite paper!
by Leandro Lucarella on 2008- 08- 11 18:55 (updated on 2008- 08- 12 01:28)- with 1 comment(s)
DGC begins
by Leandro Lucarella on 2008- 08- 10 21:59 (updated on 2008- 08- 11 03:13)- with 2 comment(s)
Ok, here I am.
First of all, this is a blog. Second, this is a blog about my informatics engineering thesis, to finally finish my long long studies at FIUBA (Engineering Faculty of the Buenos Aires University, UBA): a wild try to improve the D Programming Language garbage collector.
But don't expect too much of this blog. It's just a public place where to write my mental notes (in my poor english), things I want to remember for some point in the future.
If you are still interested, here is my plan for the short term:
I'm reading (again) the bible of GC: Garbage Collection: Algorithms for Automatic Dynamic Memory Management by Rafael Lins (whom I had the pleasure to meet in person) and Richard Jones. I'll try to evaluate the posibility of using each and every technique in that book in the D GC, leaving here all my conclusions about it. What I really want in this first (serious) pass is, at least, to discard the algorithms that are clearly not suitable for D.