Recursive vs. iterative marking
by Leandro Lucarella on 2010- 08- 30 00:54 (updated on 2010- 08- 30 00:54)- with 0 comment(s)
After a small (but important) step towards making the D GC truly concurrent (which is my main goal), I've been exploring the possibility of making the mark phase recursive instead of iterative (as it currently is).
The motivation is that the iterative algorithm makes several passes through the entire heap (it doesn't need to do the full job on each pass, it processes only the newly reachable nodes found in the previous iteration, but to look for that new reachable node it does have to iterate over the entire heap). The number of passes is the same as the connectivity graph depth, the best case is where all the heap is reachable through the root set, and the worse is when the heap is a single linked list. The recursive algorithm, on the other hand, needs only a single pass but, of course, it has the problem of potentially consuming a lot of stack space (again, the recurse depth is the same as the connectivity graph depth), so it's not paradise either.
To see how much of a problem is the recurse depth in reality, first I've implemented a fully recursive algorithm, and I found it is a real problem, since I had segmentation faults because the (8MiB by default in Linux) stack overflows. So I've implemented an hybrid approach, setting a (configurable) maximum recurse depth for the marking phase. If the maximum depth is reached, the recursion is stopped and nodes that should be scanned deeply than that are queued to scanned in the next iteration.
Here are some results showing how the total run time is affected by the maximum recursion depth:
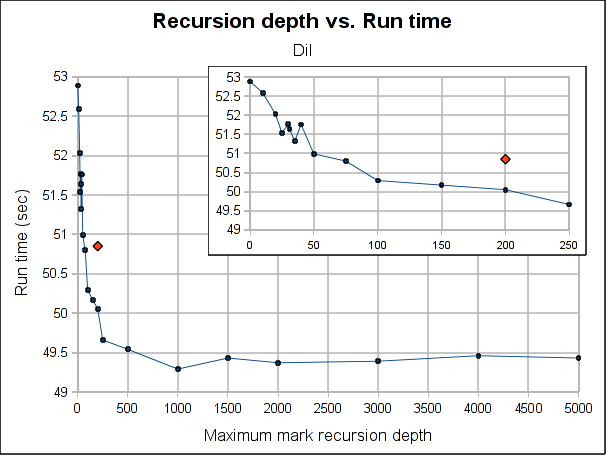
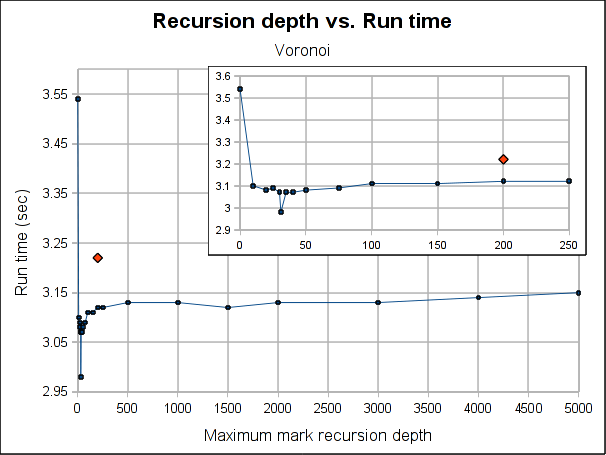
The red dot is how the pure iterative algorithm currently performs (it's placed arbitrarily in the plot, as the X-axis doesn't make sense for it).
The results are not very conclusive. Even when the hybrid approach performs better for both Dil and Voronoi when the maximum depth is bigger than 75, the better depth is program specific. Both have its worse case when depth is 0, which makes sense, because is paying the extra complexity of the hybrid algorithm with using its power. As soon as we leave the 0 depth, a big drop is seen, for Voronoi big enough to outperform the purely iterative algorithm, but not for Dil, which matches it near 60 and clearly outperforms it at 100.
As usual, Voronoi challenges all logic, as the best depth is 31 (it was a consistent result among several runs). Between 20 and 50 there is not much variation (except for the magic number 31) but when going beyond that, it worsen slowly but constantly as the depth is increased.
Note that the plots might make the performance improvement look a little bigger than it really is. The best case scenario the gain is 7.5% for Voronoi and 3% for Dil (which is probably better measure for the real world). If I had to choose a default, I'll probably go with 100 because is where both get a performance gain and is still a small enough number to ensure no segmentation faults due to stack exhaustion is caused (only) by the recursiveness of the mark phase (I guess a value of 1000 would be reasonable too, but I'm a little scared of causing inexplicable, magical, mystery segfaults to users). Anyway, for a value of 100, the performance gain is about 1% and 3.5% for Dil and Voronoi respectively.
So I'm not really sure if I should merge this change or not. In the best case scenarios (which requires a work from the user to search for the better depth for its program), the performance gain is not exactly huge and for a reasonable default value is so little that I'm not convinced the extra complexity of the change (because it makes the marking algorithm a little more complex) worth it.
Feel free to leave your opinion (I would even appreciate it if you do :).
Memory allocation patterns
by Leandro Lucarella on 2010- 08- 14 06:28 (updated on 2010- 08- 14 16:09)- with 0 comment(s)
Note
Tango 0.99.9 has a bug in its runtime, which sometimes makes the GC scan memory that should not be scanned. It only affects Dil and Voronoi programs, but in a significant way. The tests in this post are done using a patched runtime, with the bug fixed.
Update
The results for the unpublished programs are now available. You can find the graphic results, the detailed summary and the source code for all the programs (except dil, which can be downloaded from its home site).
After seeing some weird behaviours and how different benchmarks are more or less affected by changes like memory addresses returned by the OS or by different ways to store the type information pointer, I decided to gather some information about how much and what kind of memory are requested by the different benchmarks.
I used the information provided by the malloc_stats_file CDGC option, and generated some stats.
The analysis is done on the allocations requested by the program (calls to gc_malloc()) and contrasting that with the real memory allocated by the GC. Note that only the GC heap memory (that is, memory dedicated to the program, which the GC scans in the collections) is counted (internal GC memory used for bookkeeping is not).
Also note that in this post I generally refer to object meaning a block of memory, it doesn't mean they are actually instance of a class or anything. Finally bear in mind that all the figures shown here are the sum of all the allocations done in the life of a program. If the collected data says a program requested 1GiB of memory, that doesn't mean the program had a residency of 1GiB, the program could had a working set of a few KiB and recycled memory like hell.
When analyzing the real memory allocated by the GC, there are two modes being analyzed, one is the classic conservative mode and the other is the precise mode (as it is in the original patch, storing the type information pointer at the end of the blocks). So the idea here is to measure two major things:
- The amount of memory wasted by the GC because of how it arranges memory as fixed-size blocks (bins) and large objects that uses whole pages.
- The extra amount of memory wasted by the GC when using precise mode because it stores the type information pointer at the end of the blocks.
I've selected a few representative benchmarks. Here are the results:
bh allocation pattern
This is a translation by Leonardo Maffi from the Olden Benchmark that does a Barnes–Hut simulation. The program is CPU intensive an does a lot of allocation of about 5 different small objects.
Here is a graphic summary of the allocation requests and real allocated memory for a run with -b 4000:


We can easily see here how the space wasted by the GC memory organization is significant (about 15% wasted), and how the type information pointer is adding an even more significant overhead (about 36% of the memory is wasted). This means that this program will be 15% more subject to false pointers (and will have to scan some extra memory too, but fortunately the majority of the memory doesn't need to be scanned) than it should in conservative mode and that the precise mode makes things 25% worse.
You can also see how the extra overhead in the precise mode is because some objects that should fit in a 16 bin now need a 32 bytes bin to hold the extra pointer. See how there were no waste at all in the conservative mode for objects that should fit a 16 bytes bin. 117MiB are wasted because of that.
Here is a more detailed (but textual) summary of the memory requested and allocated:
- Requested
- Total
- 15,432,462 objecs, 317,236,335 bytes [302.54MiB]
- Scanned
- 7,757,429 (50.27%) objecs, 125,360,510 bytes [119.55MiB] (39.52%)
- Not scanned
- 7,675,033 (49.73%) objecs, 191,875,825 bytes [182.99MiB] (60.48%)
- Different object sizes
- 8
- Objects requested with a bin size of:
- 16 bytes
- 7,675,064 (49.73%) objects, 122,801,024 bytes [117.11MiB] (38.71%)
- 32 bytes
- 7,734,214 (50.12%, 99.85% cumulative) objects, 193,609,617 bytes [184.64MiB] (61.03%, 99.74% cumulative)
- 64 bytes
- 23,181 (0.15%, 100% cumulative) objects, 824,988 bytes [805.65KiB] (0.26%, 100% cumulative)
- 256 bytes
- 2 (0%, 100% cumulative) objects, 370 bytes (0%, 100% cumulative)
- 512 bytes
- 1 (0%, 100% cumulative) objects, 336 bytes (0%, 100% cumulative)
- Allocated
- Conservative mode
- Total allocated
- 371,780,480 bytes [354.56MiB]
- Total wasted
- 54,544,145 bytes [52.02MiB], 14.67%
- Wasted due to objects that should use a bin of
- 16 bytes
- 0 bytes (0%)
- 32 bytes
- 53,885,231 bytes [51.39MiB] (98.79%, 98.79% cumulative)
- 64 bytes
- 658,596 bytes [643.16KiB] (1.21%, 100% cumulative)
- 256 bytes
- 142 bytes (0%, 100% cumulative)
- 512 bytes
- 176 bytes (0%, 100% cumulative)
- Precise mode
- Total allocated
- 495,195,296 bytes [472.26MiB]
- Total wasted
- 177,958,961 bytes [169.71MiB], 35.94%
- Wasted due to objects that should use a bin of
- 16 bytes
- 122,801,024 bytes [117.11MiB] (69.01%)
- 32 bytes
- 54,499,023 bytes [51.97MiB] (30.62%, 99.63% cumulative)
- 64 bytes
- 658,596 bytes [643.16KiB] (0.37%, 100% cumulative)
- 256 bytes
- 142 bytes (0%, 100% cumulative)
- 512 bytes
- 176 bytes (0%, 100% cumulative)
bigarr allocation pattern
This is a extremely simple program that just allocate a big array of small-medium objects (all of the same size) I found in the D NG.
Here is the graphic summary:


The only interesting part of this test is how many space is wasted because of the memory organization, which in this case goes up to 30% for the conservative mode (and have no change for the precise mode).
Here is the detailed summary:
- Requested
- Total
- 12,000,305 objecs, 1,104,160,974 bytes [1.03GiB]
- Scanned
- 12,000,305 (100%) objecs, 1,104,160,974 bytes [1.03GiB] (100%)
- Not scanned
- 0 (0%) objecs, 0 bytes (0%)
- Different object sizes
- 5
- Objects requested with a bin size of
- 128 bytes
- 12,000,000 (100%, 100% cumulative) objects, 1,056,000,000 bytes [1007.08MiB] (95.64%, 95.64% cumulative)
- 256 bytes
- 2 (0%, 100% cumulative) objects, 322 bytes (0%, 95.64% cumulative)
- 512 bytes
- 1 (0%, 100% cumulative) objects, 336 bytes (0%, 95.64% cumulative)
- more than a page
- 302 (0%) objects, 48,160,316 bytes [45.93MiB] (4.36%)
- Allocated
- Conservative mode
- Total allocated
- 1,584,242,808 bytes [1.48GiB]
- Total wasted
- 480,081,834 bytes [457.84MiB], 30.3%
- Wasted due to objects that should use a bin of
- 128 bytes
- 480,000,000 bytes [457.76MiB] (99.98%, 99.98% cumulative)
- 256 bytes
- 190 bytes (0%, 99.98% cumulative)
- 512 bytes
- 176 bytes (0%, 99.98% cumulative)
- more than a page
- 81,468 bytes [79.56KiB] (0.02%)
- Precise mode
- Total allocated
- 1,584,242,808 bytes [1.48GiB]
- Total wasted
- 480,081,834 bytes [457.84MiB], 30.3%
- Wasted due to objects that should use a bin of:
- 128 bytes
- 480,000,000 bytes [457.76MiB] (99.98%, 99.98% cumulative)
- 256 bytes
- 190 bytes (0%, 99.98% cumulative)
- 512 bytes
- 176 bytes (0%, 99.98% cumulative)
- more than a page
- 81,468 bytes [79.56KiB] (0.02%)
mcore allocation pattern
This is program that test the contention produced by the GC when appending to (thread-specific) arrays in several threads concurrently (again, found at the D NG). For this analysis the concurrency doesn't play any role though, is just a program that do a lot of appending to a few arrays.
Here are the graphic results:


This is the most boring of the examples, as everything works as expected =)
You can clearly see how the arrays grow, passing through each bin size and finally becoming big objects which take most of the allocated space. Almost nothing need to be scanned (they are int arrays), and practically there is no waste. That's a good decision by the array allocation algorithm, which seems to exploit the bin sizes to the maximum. Since almost all the data is doesn't need to be scanned, there is no need to store the type information pointers, so there is no waste either for the precise mode (the story would be totally different if the arrays were of objects that should be scanned, as probably each array allocation would waste about 50% of the memory to store the type information pointer).
Here is the detailed summary:
- Requested
- Total requested
- 367 objecs, 320,666,378 bytes [305.81MiB]
- Scanned
- 8 (2.18%) objecs, 2,019 bytes [1.97KiB] (0%)
- Not scanned
- 359 (97.82%) objecs, 320,664,359 bytes [305.81MiB] (100%)
- Different object sizes
- 278
- Objects requested with a bin size of
- 16 bytes
- 4 (1.09%) objects, 20 bytes (0%)
- 32 bytes
- 5 (1.36%, 2.45% cumulative) objects, 85 bytes (0%, 0% cumulative)
- 64 bytes
- 4 (1.09%, 3.54% cumulative) objects, 132 bytes (0%, 0% cumulative)
- 128 bytes
- 4 (1.09%, 4.63% cumulative) objects, 260 bytes (0%, 0% cumulative)
- 256 bytes
- 6 (1.63%, 6.27% cumulative) objects, 838 bytes (0%, 0% cumulative)
- 512 bytes
- 9 (2.45%, 8.72% cumulative) objects, 2,708 bytes [2.64KiB] (0%, 0% cumulative)
- 1024 bytes
- 4 (1.09%, 9.81% cumulative) objects, 2,052 bytes [2KiB] (0%, 0% cumulative)
- 2048 bytes
- 4 (1.09%, 10.9% cumulative) objects, 4,100 bytes [4KiB] (0%, 0% cumulative)
- 4096 bytes
- 4 (1.09%, 11.99% cumulative) objects, 8,196 bytes [8KiB] (0%, 0.01% cumulative)
- more than a page
- 323 (88.01%) objects, 320,647,987 bytes [305.79MiB] (99.99%)
- Allocated
- Conservative mode
- Total allocated
- 321,319,494 bytes [306.43MiB]
- Total wasted
- 653,116 bytes [637.81KiB], 0.2%
- Wasted due to objects that should use a bin of
- 16 bytes
- 44 bytes (0.01%)
- 32 bytes
- 75 bytes (0.01%, 0.02% cumulative)
- 64 bytes
- 124 bytes (0.02%, 0.04% cumulative)
- 128 bytes
- 252 bytes (0.04%, 0.08% cumulative)
- 256 bytes
- 698 bytes (0.11%, 0.18% cumulative)
- 512 bytes
- 1,900 bytes [1.86KiB] (0.29%, 0.47% cumulative)
- 1024 bytes
- 2,044 bytes [2KiB] (0.31%, 0.79% cumulative)
- 2048 bytes
- 4,092 bytes [4KiB] (0.63%, 1.41% cumulative)
- 4096 bytes
- 8,188 bytes [8KiB] (1.25%, 2.67% cumulative)
- more than a page
- 635,699 bytes [620.8KiB] (97.33%)
- Precise mode
- Total allocated
- 321,319,494 bytes [306.43MiB]
- Total wasted
- 653,116 bytes [637.81KiB], 0.2%
- Wasted due to objects that should use a bin of
- 16 bytes
- 44 bytes (0.01%)
- 32 bytes
- 75 bytes (0.01%, 0.02% cumulative)
- 64 bytes
- 124 bytes (0.02%, 0.04% cumulative)
- 128 bytes
- 252 bytes (0.04%, 0.08% cumulative)
- 256 bytes
- 698 bytes (0.11%, 0.18% cumulative)
- 512 bytes
- 1,900 bytes [1.86KiB] (0.29%, 0.47% cumulative)
- 1024 bytes
- 2,044 bytes [2KiB] (0.31%, 0.79% cumulative)
- 2048 bytes
- 4,092 bytes [4KiB] (0.63%, 1.41% cumulative)
- 4096 bytes
- 8,188 bytes [8KiB] (1.25%, 2.67% cumulative)
- more than a page
- 635,699 bytes [620.8KiB] (97.33%)
voronoi allocation pattern
This is one of my favourites, because is always problematic. It "computes the voronoi diagram of a set of points recursively on the tree" and is also taken from the Olden Benchmark and translated by Leonardo Maffi to D.
Here are the graphic results for a run with -n 30000:


This have a little from all the previous examples. Practically all the heap should be scanned (as in bigarr), it wastes a considerably portion of the heap because of the fixed-size blocks (as all but mcore), it wastes just a very little more because of type information (as all but bh) but that waste comes from objects that should fit in a 16 bytes bin but is stored in a 32 bytes bin instead (as in bh).
Maybe that's why it's problematic, it touches a little mostly all the GC flaws.
Here is the detailed summary:
- Requested
- Total requested
- 1,309,638 objecs, 33,772,881 bytes [32.21MiB]
- Scanned
- 1,309,636 (100%) objecs, 33,772,849 bytes [32.21MiB] (100%)
- Not scanned
- 2 (0%) objecs, 32 bytes (0%)
- Different object sizes
- 6
- Objects requested with a bin size of
- 16 bytes
- 49,152 (3.75%) objects, 786,432 bytes [768KiB] (2.33%)
- 32 bytes
- 1,227,715 (93.74%, 97.5% cumulative) objects, 31,675,047 bytes [30.21MiB] (93.79%, 96.12% cumulative)
- 64 bytes
- 32,768 (2.5%, 100% cumulative) objects, 1,310,720 bytes [1.25MiB] (3.88%, 100% cumulative)
- 256 bytes
- 2 (0%, 100% cumulative) objects, 346 bytes (0%, 100% cumulative)
- 512 bytes
- 1 (0%, 100% cumulative) objects, 336 bytes (0%, 100% cumulative)
- Allocated
- Conservative mode
- Total allocated
- 42,171,488 bytes [40.22MiB]
- Total wasted
- 8,398,607 bytes [8.01MiB], 19.92%
- Wasted due to objects that should use a bin of
- 16 bytes
- 0 bytes (0%)
- 32 bytes
- 7,611,833 bytes [7.26MiB] (90.63%, 90.63% cumulative)
- 64 bytes
- 786,432 bytes [768KiB] (9.36%, 100% cumulative)
- 256 bytes
- 166 bytes (0%, 100% cumulative)
- 512 bytes
- 176 bytes (0%, 100% cumulative)
- Precise mode
- Total allocated
- 42,957,888 bytes [40.97MiB]
- Total wasted
- 9,185,007 bytes [8.76MiB], 21.38%
- Wasted due to objects that should use a bin of
- 16 bytes
- 786,400 bytes [767.97KiB] (8.56%)
- 32 bytes
- 7,611,833 bytes [7.26MiB] (82.87%, 91.43% cumulative)
- 64 bytes
- 786,432 bytes [768KiB] (8.56%, 100% cumulative)
- 256 bytes
- 166 bytes (0%, 100% cumulative)
- 512 bytes
- 176 bytes (0%, 100% cumulative)
Dil allocation pattern
Finally, this is by far my favourite, the only real-life program, and the most colorful example (literally =).
Dil is a D compiler, and as such, it works a lot with strings, a lot of big chunks of memory, a lot of small objects, it has it all! String manipulation stress the GC a lot, because it uses objects (blocks) of all possible sizes ever, specially extremely small objects (less than 8 bytes, even a lot of blocks of just one byte!).
Here are the results of a run of Dil to generate Tango documentation (around 555 source files are processed):


Didn't I say it was colorful?
This is like the voronoi but taken to the extreme, it really have it all, it allocates all types of objects in significant quantities, it wastes a lot of memory (23%) and much more when used in precise mode (33%).
Here is the detailed summary:
- Requested
- Total
- 7,307,686 objecs, 322,411,081 bytes [307.48MiB]
- Scanned
- 6,675,124 (91.34%) objecs, 227,950,157 bytes [217.39MiB] (70.7%)
- Not scanned
- 632,562 (8.66%) objecs, 94,460,924 bytes [90.08MiB] (29.3%)
- Different object sizes
- 6,307
- Objects requested with a bin size of
- 16 bytes
- 2,476,688 (33.89%) objects, 15,693,576 bytes [14.97MiB] (4.87%)
- 32 bytes
- 3,731,864 (51.07%, 84.96% cumulative) objects, 91,914,815 bytes [87.66MiB] (28.51%, 33.38% cumulative)
- 64 bytes
- 911,016 (12.47%, 97.43% cumulative) objects, 41,918,888 bytes [39.98MiB] (13%, 46.38% cumulative)
- 128 bytes
- 108,713 (1.49%, 98.91% cumulative) objects, 8,797,572 bytes [8.39MiB] (2.73%, 49.11% cumulative)
- 256 bytes
- 37,900 (0.52%, 99.43% cumulative) objects, 6,354,323 bytes [6.06MiB] (1.97%, 51.08% cumulative)
- 512 bytes
- 22,878 (0.31%, 99.75% cumulative) objects, 7,653,461 bytes [7.3MiB] (2.37%, 53.45% cumulative)
- 1024 bytes
- 7,585 (0.1%, 99.85% cumulative) objects, 4,963,029 bytes [4.73MiB] (1.54%, 54.99% cumulative)
- 2048 bytes
- 3,985 (0.05%, 99.9% cumulative) objects, 5,451,493 bytes [5.2MiB] (1.69%, 56.68% cumulative)
- 4096 bytes
- 2,271 (0.03%, 99.93% cumulative) objects, 6,228,433 bytes [5.94MiB] (1.93%, 58.61% cumulative)
- more than a page
- 4,786 (0.07%) objects, 133,435,491 bytes [127.25MiB] (41.39%)
- Allocated
- Conservative mode
- Total allocated
- 419,368,774 bytes [399.94MiB]
- Total wasted
- 96,957,693 bytes [92.47MiB], 23.12%
- Wasted due to objects that should use a bin of
- 16 bytes
- 23,933,432 bytes [22.82MiB] (24.68%)
- 32 bytes
- 27,504,833 bytes [26.23MiB] (28.37%, 53.05% cumulative)
- 64 bytes
- 16,386,136 bytes [15.63MiB] (16.9%, 69.95% cumulative)
- 128 bytes
- 5,117,692 bytes [4.88MiB] (5.28%, 75.23% cumulative)
- 256 bytes
- 3,348,077 bytes [3.19MiB] (3.45%, 78.68% cumulative)
- 512 bytes
- 4,060,075 bytes [3.87MiB] (4.19%, 82.87% cumulative)
- 1024 bytes
- 2,804,011 bytes [2.67MiB] (2.89%, 85.76% cumulative)
- 2048 bytes
- 2,709,787 bytes [2.58MiB] (2.79%, 88.56% cumulative)
- 4096 bytes
- 3,073,583 bytes [2.93MiB] (3.17%, 91.73% cumulative)
- more than a page
- 8,020,067 bytes [7.65MiB] (8.27%)
- Precise mode:
- Total allocated
- 482,596,774 bytes [460.24MiB]
- Total wasted
- 160,185,693 bytes [152.76MiB], 33.19%
- Wasted due to objects that should use a bin of
- 16 bytes
- 26,820,824 bytes [25.58MiB] (16.74%)
- 32 bytes
- 85,742,913 bytes [81.77MiB] (53.53%, 70.27% cumulative)
- 64 bytes
- 18,070,872 bytes [17.23MiB] (11.28%, 81.55% cumulative)
- 128 bytes
- 5,221,884 bytes [4.98MiB] (3.26%, 84.81% cumulative)
- 256 bytes
- 3,400,557 bytes [3.24MiB] (2.12%, 86.93% cumulative)
- 512 bytes
- 4,125,611 bytes [3.93MiB] (2.58%, 89.51% cumulative)
- 1024 bytes
- 2,878,763 bytes [2.75MiB] (1.8%, 91.31% cumulative)
- 2048 bytes
- 2,760,987 bytes [2.63MiB] (1.72%, 93.03% cumulative)
- 4096 bytes
- 3,143,215 bytes [3MiB] (1.96%, 94.99% cumulative)
- more than a page
- 8,020,067 bytes [7.65MiB] (5.01%)
Conclusion
I've analyzed other small fabricated benchmarks, but all of them had results very similar to the ones shown here.
I think the overallocation problem is more serious than what one might think at first sight. Bear in mind this is not GC overhead, is not because of internal GC data. Is memory the GC or the mutator cannot use. Is memory wasted because of fragmentation (planned fragmentation, but fragmentation at least). And I don't think this is the worse problem. The worse problem is, this memory will need to be scanned in most cases (Dil needs to scan 70% of the total memory requested), and maybe the worse of all is that is subject to false pointer. A false pointer to a memory location that is not actually being used by the program will keep the block alive! If is a large object (several pages) that could be pretty nasty.
This problems can be addressed in several ways. One is mitigate the problem by checking (when type information is available) what portions of the memory is really used and what is wasted, and don't keep things alive when they are only pointed to wasted memory. This is not free though, it will consume more CPU cycles so the solution could be worse than the problem.
I think it worth experimenting with other heap organizations, for example, I would experiment with one free list for object size instead of pre-fixed-sizes. I would even experiment with a free list for each type when type information is available, that would save a lot of space (internal GC space) when storing type information. Some specialization for strings could be useful too.
Unfortunately I don't think I'll have the time to do this, at least for the thesis, but I think is a very rich and interesting ground to experiment.
Type information at the end of the block considered harmful
by Leandro Lucarella on 2010- 08- 07 17:24 (updated on 2010- 08- 09 13:22)- with 0 comment(s)
Yes, I know I'm not Dijkstra, but I always wanted to do a considered harmful essay =P
And I'm talking about a very specific issue, so this will probably a boring reading for most people :)
This is about my research in D garbage collection, the CDGC, and related to a recent post and the precise heap scanning patch.
I've been playing with the patch for a couple of weeks now, and even when some of the tests in my benchmark became more stable, other tests had the inverse effect, and other tests even worsen their performance.
The extra work done by the patch should not be too significant compared with the work it avoids by no scanning things that are no pointers, so the performance, intuitively speaking, should be considerably increased for test that have a lot of false pointers and for the other tests, at least not be worse or less stable. But that was not what I observed.
I finally got to investigate this issue, and found out that when the precise version was clearly slower than the Tango basic collector, it was due to a difference in the number of collections triggered by the test. Sometimes a big difference, and sometimes with a lot of variation. The number usually never approached to the best value achieved by the basic collector.
For example, the voronoi test with N = 30_000, the best run with the basic collector triggered about 60 collections, varying up to 90, while the precise scanning triggered about 80, with very little variation. Even more, if I ran the tests using setarch to avoid heap addresses randomization (see the other post for details), the basic collector triggered about 65 collections always, while the precise collector still triggered 80, so there was something wrong with the precise scanning independently of the heap addresses.
So the suspicions I had about storing the type information pointer at the end of the block being the cause of the problem became even more suspicious. So I added an option to make the precise collector conservative. The collection algorithm, that changed between collectors, was untouched, the precise collector just don't store the type information when is configured in conservative mode, so it scans all the memory as if it didn't had type information. The results where almost the same as the basic collector, so the problem really was the space overhead of storing the type information in the same blocks the mutator stores it's data.
It looks like the probability of keeping blocks alive incorrectly because of false pointer, even when they came just from the static data and the stack (and other non-precise types, like unions) is increased significantly because of the larger blocks.
The I tried to strip the programs (all the test were using programs with debug info to ease the debugging when I brake the GC :), and the number of collections decreased considerably in average, and the variation between runs too. So it looks like that in the scanned static data are included the debug symbols or there is something else adding noise. This for both precise and conservative scanning, but the effect is worse with precise scanning. Running the programs without heap address randomization (setarch -R), usually decreases the number of collections and the variance too.
Finally, I used a very naïve (but easy) way of storing the type information pointers outside the GC scanned blocks, wasting 25% of space just to store this information (as explained in a comment to the bug report), but I insist, that overhead is outside the GC scanned blocks, unlike the small overhead imposed by storing a pointer at the end of that blocks. Even with such high memory overhead, the results were surprising, the voronoi number of collections doing precise scanning dropped to about 68 (very stable) and the total runtime was a little smaller than the best basic GC times, which made less collections (and were more unstable between runs).
Note that there are still several test that are worse for the CDGC (most notably Dil, the only real-life application :), there are plenty of changes between both collectors and I still didn't look for the causes.
I'll try to experiment with a better way of storing the type information pointers outside the GC blocks, probably using a hash table.
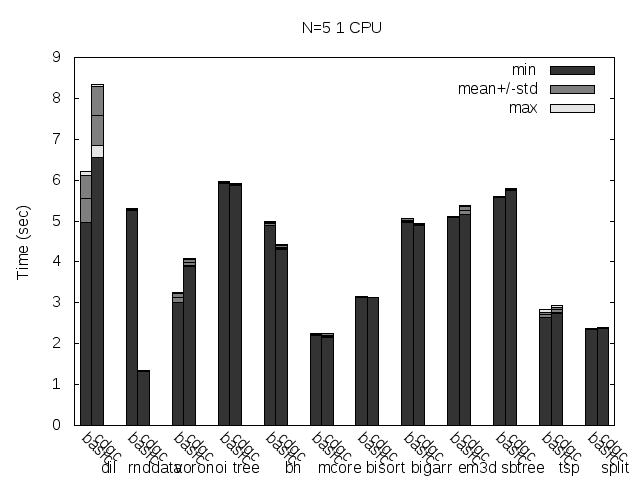
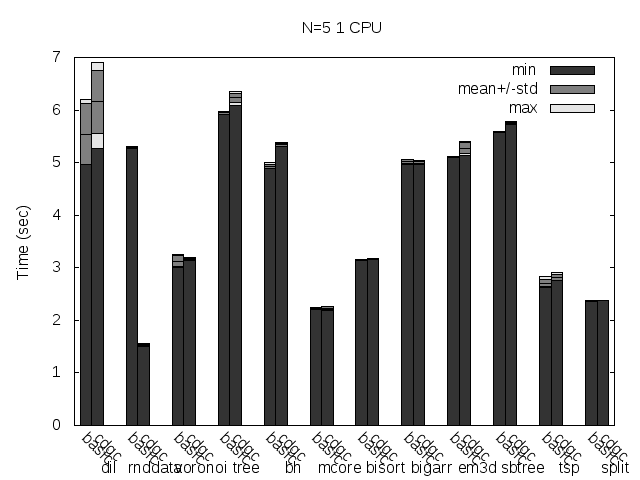
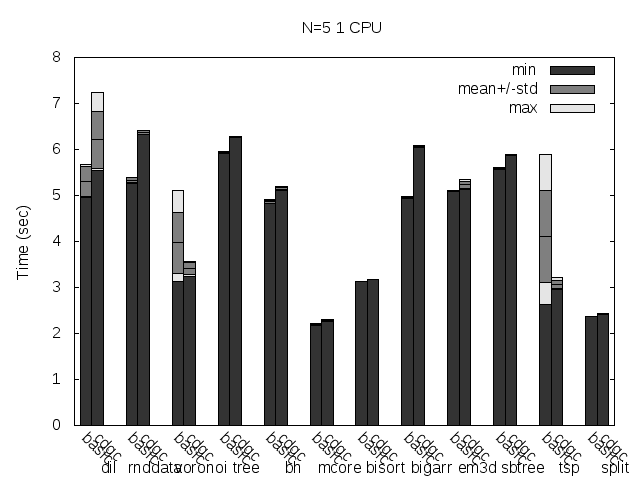
At last but not least, here are some figures (basic is the Tango basic collector, cdgc is the CDGC collector with the specified modifications):
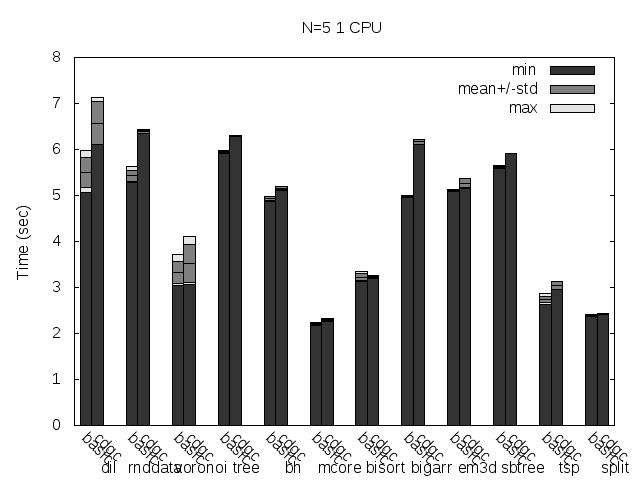
Precise scanning patch doing conservative scanning (not storing the type information at all).
Precise scanning storing the type information at the end of the GC blocks.
Precise scanning storing the type information outside the GC blocks.
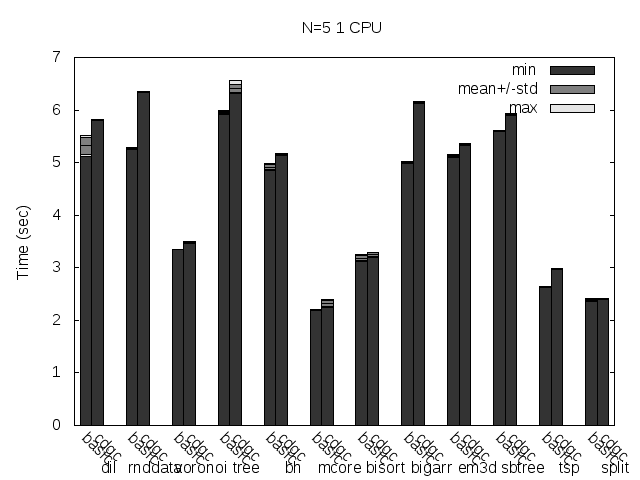
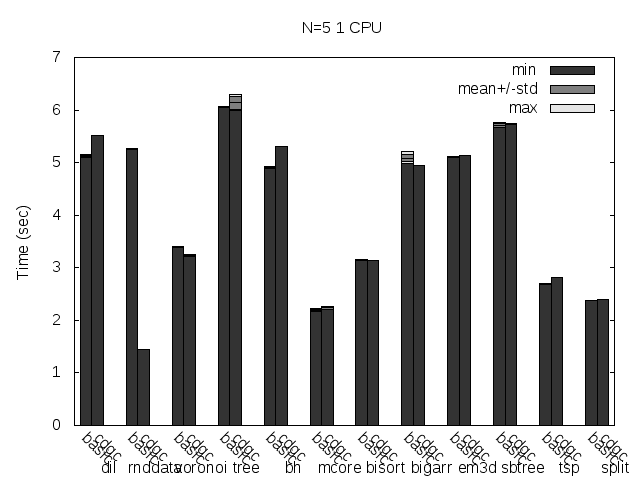
Here are the same tests, but with the binaries stripped:
Precise scanning patch doing conservative scanning (not storing the type information at all). Stripped.

Precise scanning storing the type information at the end of the GC blocks. Stripped.

Precise scanning storing the type information outside the GC blocks. Stripped.
Here are the same tests as above, but disabling Linux heap addresses randomization (setarch -R):
Precise scanning patch doing conservative scanning (not storing the type information at all). Stripped. No addresses randomization.

Precise scanning storing the type information at the end of the GC blocks. Stripped. No addresses randomization.
Precise scanning storing the type information outside the GC blocks. Stripped. No addresses randomization.
Update
I noticed that the plots doesn't always reflect 100% what's stated in the text, that is because the text was written with another run results and it seems like the tested programs are very sensitive to the heap and binary addresses the kernel assign to the program.
Anyway, what you can see in the plots very clear is how stripping the binaries changes the results a lot and how the performance is particularly improved when storing the type information pointer outside the GC'ed memory when the binaries are not stripped.
Stats for the basic GC
by Leandro Lucarella on 2009- 10- 08 23:08 (updated on 2009- 10- 08 23:08)- with 0 comment(s)
Here are some graphs made from my D GC benchmarks using the Tango (0.99.8) basic collector, similar to the naive ones but using histograms for allocations (time and space):


Some comments:
- The Wasted space is the Uncommitted space (since the basic GC doesn't track the real size of the stored object).
- The Stop-the-world time is the time all the threads are stopped, which is almost the same as the time spent scanning the heap.
- The Collect time is the total time spent in a collection. The difference with the Stop-the-world time is almost the same as the time spent in the sweep phase, which is done after the threads have being resumed (except the thread that triggered the collection).
There are a few observations to do about the results:
- The stop the world time varies a lot. There are tests where is almost unnoticeable (tree), tests where it's almost equals to the total collection time (rnd_data, rnd_data_2, split) and test where it's in the middle (big_arrays). I can't see a pattern though (like heap occupancy).
- There are tests where it seems that collections are triggered for no reason; there is plenty of free space when it's triggered (tree and big_arrays). I haven't investigated this yet, so if you can see a reason, please let me know.
Life in hell
by Leandro Lucarella on 2009- 09- 06 21:24 (updated on 2009- 09- 06 21:24)- with 0 comment(s)
Warning
Long post ahead =)
As I said before, debug is hell in D, at least if you're using a compiler that doesn't write proper debug information and you're writing a garbage collector. But you have to do it when things go wrong. And things usually go wrong.
This is a small chronicle about how I managed to debug a weird problem =)
I had my Naive GC working and getting good stats with some small micro-benchmarks, so I said let's benchmark something real. There is almost no real D applications out there, suitable for an automated GC benchmark at least [1]. Dil looked like a good candidate so I said let's use Dil in the benchmark suite!.
And I did. But Dil didn't work as I expected. Even when running it without arguments, in which case a nice help message like this should be displayed:
dil v1.000
Copyright (c) 2007-2008 by Aziz Köksal. Licensed under the GPL3.

Subcommands:
  help (?)
  compile (c)
  ddoc (d)
  highlight (hl)
  importgraph (igraph)
  python (py)
  settings (set)
  statistics (stats)
  tokenize (tok)
  translate (trans)

Type 'dil help <subcommand>' for more help on a particular subcommand.

Compiled with Digital Mars D v1.041 on Sat Aug 29 18:04:34 2009.
I got this instead:
Generate an XML or HTML document from a D source file.
Usage:
  dil gen file.d [Options]

Options:
  --syntax         : generate tags for the syntax tree
  --xml            : use XML format (default)
  --html           : use HTML format

Example:
  dil gen Parser.d --html --syntax > Parser.html
Which it isn't even a valid Dil command (it looks like a dead string in some data/lang_??.d files).
I ran Valgrind on it and detected a suspicious invalid read of size 4 when reading the last byte of a 13 bytes long class instance. I thought maybe the compiler was assuming the GC allocated block with size multiples of the word size, so I made gc_malloc() allocate multiples of the word size, but nothing happened. Then I thought that maybe the memory blocks should be aligned to a multiple of a word, so I made gc_malloc() align the data portion of the cell to a multiple of a word, but nothing.
Since Valgrind only detected that problem, which was at the static constructor of the module tango.io.Console, I though it might be a Tango bug, so I reported it. But it wasn't Tango's fault. The invalid read looked like a DMD 1.042 bug; DMD 1.041 didn't have that problem, but my collector still failed to run Dil. So I was back to zero.
I tried the Tango stub collector and it worked, so I tried mine disabling the collections, and it worked too. So finally I could narrow the problem to the collection phase (which isn't much, but it's something). The first thing I could think it could be wrong in a collection is that cells still in use are swept as if they were unused, so I then disabled the sweep phase only, and it kept working.
So, everything pointer to prematurely freed cells. But why my collector was freeing cells prematurely being so, so simple? I reviewed the code a couple of times and couldn't find anything evidently wrong. To confirm my theory and with the hope of getting some extra info, I decided to write a weird pattern in the swept cells and then check if that pattern was intact when giving them back to the mutator (the basic GC can do that too if compiled with -debug=MEMSTOMP). That would confirm that the swept memory were still in use. And it did.
The I tried this modified GC with memory stomp with my micro-benchmarks and they worked just fine, so I started to doubt again that it was my GC's problem. But since those benchmarks didn't use much of the GC API, I thought maybe Dil was using some strange features of making some assumptions that were only true for the current implementation, so I asked Aziz Köksal (Dil creator) and he pointed me to some portion of code that allocated memory from the C heap, overriding the operators new and delete for the Token struct. There is a bug in Dil there, because apparently that struct store pointers to the GC heap but it's not registered as a root, so it looks like a good candidate.
So I commented out the overridden new and delete operators, so the regular GC-based operators were used. But I still got nothing, the wrong help message were printed again. Then I saw that Dil was manually freeing memory using delete. So I decided to make my gc_free() implementation a NOP to let the GC take over of all memory management... And finally all [2] worked out fine! =)
So, the problem should be either my gc_free() implementation (which is really simple) or a Dil bug.
In order to get some extra information on where the problem is, I changed the Cell.alloc() implementation to use mmap to allocate whole pages, one for the cell's header, and one or more for the cell data. This way, could easily mprotect the cell data when the cell was swept (and un-mprotecting them when they were give back to the program) in order to make Dil segfault exactly where the freed memory was used.
I ran Dil using strace and this is what happened:
[...]
 (a)  write(1, "Cell.alloc(80)\n", 15)        = 15
 (b)  mmap2(NULL, 8192, PROT_READ|PROT_WRITE, ...) = 0xb7a2e000
[...]
 (c)  mprotect(0xb7911000, 4096, PROT_NONE)   = 0
      mprotect(0xb7913000, 4096, PROT_NONE)   = 0
[...]
      mprotect(0xb7a2b000, 4096, PROT_NONE)   = 0
      mprotect(0xb7a2d000, 4096, PROT_NONE)   = 0
 (d)  mprotect(0xb7a2f000, 4096, PROT_NONE)   = 0
      mprotect(0xb7a43000, 4096, PROT_NONE)   = 0
      mprotect(0xb7a3d000, 4096, PROT_NONE)   = 0
[...]
      mprotect(0xb7a6b000, 4096, PROT_NONE)   = 0
 (e)  mprotect(0xb7a73000, 4096, PROT_NONE)   = 0
 (f)  mprotect(0xb7a73000, 4096, PROT_READ|PROT_WRITE) = 0
      mprotect(0xb7a6b000, 4096, PROT_READ|PROT_WRITE) = 0
[...]
      mprotect(0xb7a3f000, 4096, PROT_READ|PROT_WRITE) = 0
 (g)  mprotect(0xb7a3d000, 4096, PROT_READ|PROT_WRITE) = 0
      --- SIGSEGV (Segmentation fault) @ 0 (0) ---
      +++ killed by SIGSEGV (core dumped) +++
(a) is a debug print, showing the size of the gc_malloc() call that got the address 0xb7a2e000. The mmap (b) is 8192 bytes in size because I allocate a page for the cell header (for internal GC information) and another separated page for the data (so I can only mprotect the data page and keep the header page read/write); that allocation asked for a new fresh couple of pages to the OS (that's why you see a mmap).
From (c) to (e) you can see a sequence of several mprotect, that are cells being swept by a collection (protecting the cells against read/write so if the mutator tries to touch them, a SIGSEGV is on the way).
From (f) to (g) you can see another sequence of mprotect, this time giving the mutator permission to touch that pages, so that's gc_malloc() recycling the recently swept cells.
(d) shows the cell allocated in (a) being swept. Why the address is not the same (this time is 0xb7a2f000 instead of 0xb7a2e000)? Because, as you remember, the first page is used for the cell header, so the data should be at 0xb7a2e000 + 4096, which is exactly 0xb7a2f000, the start of the memory block that the sweep phase (and gc_free() for that matter) was protecting.
Finally we see the program getting his nice SIGSEGV and dumping a nice little core for touching what it shouldn't.
Then I opened the core with GDB and did something like this [3]:
Program terminated with signal 11, Segmentation fault.
(a)  #0  0x08079a96 in getDispatchFunction ()
     (gdb) print $pc
(b)  $1 = (void (*)()) 0x8079a96 <getDispatchFunction+30>
     (gdb) disassemble $pc
     Dump of assembler code for function
     getDispatchFunction:
     0x08079a78 <getDispatchFunction+0>:  push   %ebp
     0x08079a79 <getDispatchFunction+1>:  mov    %esp,%ebp
     0x08079a7b <getDispatchFunction+3>:  sub    $0x8,%esp
     0x08079a7e <getDispatchFunction+6>:  push   %ebx
     0x08079a7f <getDispatchFunction+7>:  push   %esi
     0x08079a80 <getDispatchFunction+8>:  mov    %eax,-0x4(%ebp)
     0x08079a83 <getDispatchFunction+11>: mov    -0x4(%ebp),%eax
     0x08079a86 <getDispatchFunction+14>: call   0x80bccb4 <objectInvariant>
     0x08079a8b <getDispatchFunction+19>: push   $0xb9
     0x08079a90 <getDispatchFunction+24>: mov    0x8(%ebp),%edx
     0x08079a93 <getDispatchFunction+27>: add    $0xa,%edx
(c)  0x08079a96 <getDispatchFunction+30>: movzwl (%edx),%ecx
     [...]
     (gdb) print /x $edx
(d)  $2 = 0xb7a2f000
First, in (a), GDB tells where the program received the SIGSEGV. In (b) I print the program counter register to get a more readable hint on where the program segfaulted. It was at getDispatchFunction+30, so I disassemble that function to see that the SIGSEGV was received when doing movzwl (%edx),%ecx (moving the contents of the ECX register to the memory pointed to by the address in the register EDX) at (c). In (d) I get the value of the EDX register, and it's 0xb7a2f000. Do you remember that value? Is the data address for the cell at 0xb7a2e000, the one that was recently swept (and mprotected). That's not good for business.
This is the offending method (at dil/src/ast/Visitor.d):
Node function(Visitor, Node) getDispatchFunction()(Node n)
{
    return cast(Node function(Visitor, Node))dispatch_vtable[n.kind];
}
Since I can't get any useful information from GDB (I can't even get a proper backtrace [4]) except for the mangled function name (because the wrong debug information produced by DMD), I had to split that function into smaller functions to confirm that the problem was in n.kind (I guess I could figure that out by eating some more assembly, but I'm not that well trained at eating asm yet =). This means that the Node instance n is the one prematurely freed.
This is particularly weird, because it looks like the node is being swept, not prematurely freed using an explicit delete. So it seems like the GC is missing some roots (or there are non-aligned pointers or weird stuff like that). The fact that this works fine with the Tango basic collector is intriguing too. One thing I can come up with to explain why it works in the basic collector is because it makes a lot less collections than the naive GC (the latter is really lame =). So maybe the rootless object becomes really free before the basic collector has a chance to run a collection and because of that the problem is never detected.
I spent over 10 days now investigating this issue (of course this is not near a full-time job for me so I can only dedicate a couple of days a week to this =), and I still can't find a clear cause for this problem, but I'm a little inclined towards a Dil bug, so I reported one =). So we'll see how this evolves; for now I'll just make gc_free() a NOP to continue my testing...
| [1] | Please let me know if you have any working, real, Tango-based D application suitable for GC benchmarks (i.e., using the GC and easily scriptable to run it automatically). |
| [2] | all being running Dil without arguments to get the right help message =) |
| [3] | I have shortened the name of the functions because they were huge, cryptic, mangled names =). The real name of getDispatchFunction is _D3dil3ast7Visitor7Visitor25__T19getDispatchFunctionZ19getDispatchFunctionMFC3dil3ast4Node4NodeZPFC3dil3ast7Visitor7VisitorC3dil3ast4Node4NodeZC3dil3ast4Node4Node (is not much better when demangled: class dil.ast.Node.Node function(class dil.ast.Visitor.Visitor, class dil.ast.Node.Node)* dil.ast.Visitor.Visitor.getDispatchFunction!().getDispatchFunction(class dil.ast.Node.Node) =). The real name of objectInvariant is D9invariant12_d_invariantFC6ObjectZv and has no demagled name that I know of, but I guessed is the Object class invariant. |
| [4] | Here is what I get from GDB: (gdb) bt #0 0x08079a96 in getDispatchFunction () #1 0xb78d5000 in ?? () #2 0xb789d000 in ?? () Backtrace stopped: previous frame inner to this frame (corrupt stack?) (function name unmangled and shortened for readbility) |
Allocations graphs
by Leandro Lucarella on 2009- 08- 27 00:54 (updated on 2009- 08- 27 00:54)- with 0 comment(s)
Here are a set of improved statistics graphs, now including allocation statistics. All the data is plotted together and using the same timeline to ease the analysis and comparison.
Again, all graphs (as the graph title says), are taken using the Naive GC (stats code still not public yet :) and you can find the code for it in my D GC benchmark repository.
This time the (big) graphs are in EPS format because I could render them in PNG as big as I wanted and I didn't had the time to fix that =S


The graphs shows the same as in the previous post with the addition of allocation time (how long it took to perform the allocation) and space (how many memory has been requested), which are rendered in the same graph, and an histogram of cell sizes. The histogram differentiates cells with and without the NO_SCAN bit, which might be useful in terms on seeing how bad the effect of false positives could be.
You can easily see how allocation time peeks match allocations that triggered a collection for example, and how bad can it be the effect of false positives, even when almost all the heap (99.99%) has the NO_SCAN bit (see rnd_data_2).
Graphs
by Leandro Lucarella on 2009- 08- 18 03:26 (updated on 2009- 08- 18 03:26)- with 0 comment(s)
It's been exactly 3 months since the last post. I spent the last months writing my thesis document (in Spanish), working, and being unproductive because of the lack of inspiration =)
But in the last couple of days I decided to go back to the code, and finish the statistics gathering in the Naive GC (the new code is not published yet because it needs some polishing). Here are some nice graphs from my little D GC benchmark:


The graphs shows the space and time costs for each collection in the programs life. The collection time is divided in the time spent in the malloc() that triggered the collection, the time spent in the collection itself, and the time the world has to be stopped (meaning the time all the threads were paused because of the collection). The space is measured before and after the collection, and the total memory consumed by the program is divided in 4 areas: used space, free space, wasted space (space that the user can't use but it's not used by the collector either) and overhead (space used by the collector itself).
As you can see, the naive collector pretty much sucks, specially for periods of lots of allocation (since it just allocated what it's asked in the gc_malloc() call if the collection failed).
The next step is to modify the Tango's Basic collector to gather the same data and see how things are going with it.
Statistics, benchmark suite and future plans
by Leandro Lucarella on 2009- 05- 02 01:43 (updated on 2009- 05- 02 01:43)- with 4 comment(s)
I'm starting to build a benchmark suite for D. My benchmarks and programs request was a total failure (only Leonardo Maffi offered me a small trivial GC benchmark) so I have to find my own way.
This is a relative hard task, I went through dsource searching for real D programs (written using Tango, I finally desisted in making Phobos work in LDC because it would be a very time consuming task) and had no much luck either. Most of the stuff there are libraries, the few programs are: not suitable for an automated benchmark suite (like games), abandoned or work with Phobos.
I found only 2 candidates:
I just tried dack for now (I tried MiniD a while ago but had some compilation errors, I have to try again). Web-GMUI seems like a nice maintained candidate too, but being a client to monitor other BitTorrent clients, seems a little hard to use in automated benchmarks.
For a better usage of the benchmark suite, I'm adding some statistics gathering to my Naive GC implementation, and I will add that too to the Tango basic GC implementation. I will collect this data for each and every collection:
- Collection time
- Stop-the-world time (time all the threads were suspended)
- Current thread suspension time (this is the same as Collection time in both Naive and Tango Basic GC implementations, but it won't be that way in my final implementation)
- Heap memory used by the program
- Free heap memory
- Memory overhead (memory used by the GC not usable by the program)
The three last values will be gathered after and before the collection is made.
Anyway, if you know any program that can be suitable for use in an automated benchmark suite that uses Tango, please, please let me know.
D GC Benchmark Suite
by Leandro Lucarella on 2009- 03- 28 18:31 (updated on 2009- 03- 28 18:31)- with 0 comment(s)
I'm trying to make a benchmark suite to evaluate different GC implementations.
What I'm looking for is:
- Trivial benchmarks that stress corner cases or very specific scenarios. For example, I collected a few of this posted in the NG and other sources in the couple last years (most showing problems already solved):
- Working real-life programs, specially if they are GC-intensive (for example programs where pause times are a problem and they are visible to the user) and they are easy to get timings for (but not limited to that). Programs should be opensource in principle, but if they are not please contact me if you are willing to lend me the code for this research at least. I don't know yet if I will be targeting D1, D2 or both (probably D1), so feel free to submit anything. The only condition is the program should compile (and work) with the latest compiler/Tango versions.
Feel free to post trivial test or links to programs projects as comments or via e-mail.
Thanks!